In the last blog post, we have explored Logstash, a tool for collecting and transform log data from many different input sources. Today, we will explore Elasticsearch, a scheme-less noSQL database with a versatile („elastic“) search engine. We will perform a little Elasticsearch „Hello World“ by running Elasticsearch in a Docker container and manipulating database entries. After that we will use Logstash as a data source for populating the Elasticsearch database. This configuration is often seen in a typical log processing pipeline.
This is the second blog post of a series about the Elastic Stack (a.k.a. ELK stack):
- Part 1: Logstash „Hello World“ Example shows how to collect and translate log data with Logstash 5
- Part 2: Elasticsearch „Hello World“ Example (this blog) introduces Elasticsearch 5 for big data analysis applied to Logstash-collected data
- Part 3: Kibana „Hello World“ Example introduces Kibana 5 for data visualization and binds Logstash, Elasticsearch and Kibana together
What is Elasticsearch?
Elasticsearch is a highly scalable, distributed, scheme-less noSQL database with a versatile („elastic“) search engine. It is based on an open source project created by Elastic. In this performance comparison it has been shown that Elasticsearch performs well even for millions of documents.
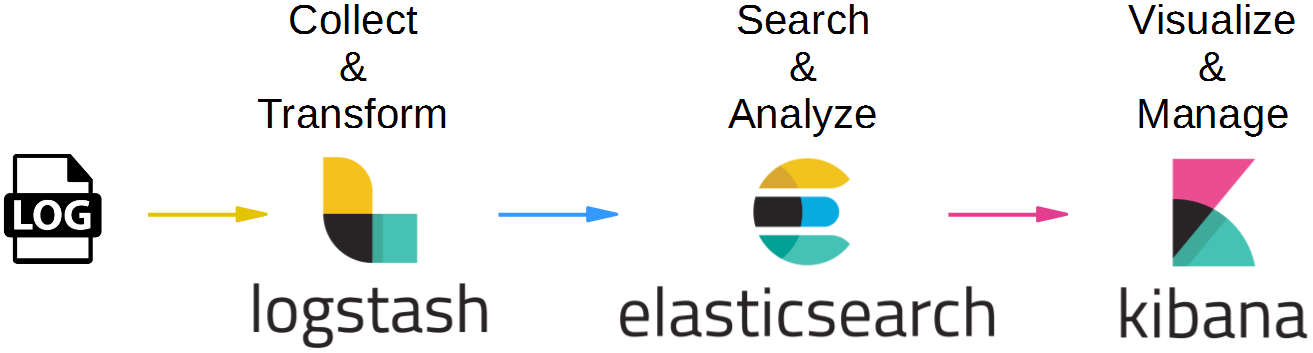
Elasticsearch is often used in the so-called ELK pipeline for log file collection, analysis and visualization:
- Elasticsearch is for searching, analyzing, and storing your data
- Logstash (and Beats) is for collecting and transforming data, from any source, in any format
- Kibana is a portal for visualizing the data and to navigate within the elastic stack
Target
In this post, we will perform a little Elasticsearch „Hello World“ by running Elasticsearch in a Docker container and create, read, search and delete our first database entries. This is done by sending simple HTTP messages towards the RESTful API of Elasticsearch:

As a second step, we will attach Logstash as a data source for Elasticsearch in order to move one step closer towards the ELK pipeline shown above:

Tools used
- Vagrant 1.8.6
- Virtualbox 5.0.20
- Docker 1.12.1
- Logstash 5.0.1
- Elasticsearch 5.0.1
Prerequisites:
- Free Memory >= 3 GB for the Elasticsearch step and >= 4 GB for the Logstash + Elasticsearch pipeline (see Appendix A).
- The max virtual memory areas vm.max_map_count must be at least 262144, see this note on the official documentation.
See also Appendix B below, how to set the value on Linux temporarily, permanently and also for the next Vagrant-created Linux VM.
Step 1: Install a Docker Host via Vagrant and Connect to the Host via SSH
We will run Elasticsearch and Logstash in Docker containers in order to allow for maximum interoperability. This way, we always can use the latest Elasticsearch and Logstash versions without the need to control the java version used: e.g. Logstash v 1.4.x works with java 7, while version 5.0.x works with java 8 only, currently.
If you are new to Docker, you might want to read this blog post.
Installing Docker on Windows and Mac can be a real challenge, but no worries: we will show an easy way here, that is much quicker than the one described in Docker’s official documentation:
Prerequisites of this step:
- I recommend to have direct access to the Internet: via Firewall, but without HTTP proxy. However, if you cannot get rid of your HTTP proxy, read this blog post.
- Administration rights on you computer.
Steps to install a Docker Host VirtualBox VM:
Download and install Virtualbox (if the installation fails with error message „<to be completed> see Appendix A of this blog post: Virtualbox Installation Workaround below)
1. Download and Install Vagrant (requires a reboot)
2. Download Vagrant Box containing an Ubuntu-based Docker Host and create a VirtualBox VM like follows:
basesystem# mkdir ubuntu-trusty64-docker ; cd ubuntu-trusty64-docker
basesystem# vagrant init williamyeh/ubuntu-trusty64-docker
basesystem# vagrant up
basesystem# vagrant ssh
Now you are logged into the Docker host and we are ready for the next step: to create the Ansible Docker image.
Note: I have experienced problems with the vi editor when running
vagrant sshin a Windows terminal. In case of Windows, consider to follow Appendix C of this blog post and to use putty instead.
Step 2 (optional): Download Elasticsearch Image
This extra download step is optional, since the Elasticsearch Docker image will be downloaded automatically in step 3, if it is not already found on the system:
(dockerhost)$ docker pull elasticsearch
Using default tag: latest
latest: Pulling from library/elasticsearch

386a066cd84a: Already exists
75ea84187083: Already exists
3e2e387eb26a: Already exists
eef540699244: Already exists
1624a2f8d114: Already exists
7018f4ec6e0a: Already exists
6ca3bc2ad3b3: Already exists
424638b495a6: Pull complete
2ff72d0b7bea: Pull complete
d0d6a2049bf2: Pull complete
51dc322097cb: Pull complete
5d6cdd5ecea8: Pull complete
51cdecfd285e: Pull complete
29a05afcfde6: Pull complete
Digest: sha256:c7eaa97e9b898b65f8f8588ade1c9c6187420b8ce6efb7d3300d9213cd5cb0dc
Status: Downloaded newer image for elasticsearch:latest
The version of the downloaded Elasticsearch image can be checked with following command:
(dockerhost)$ sudo docker run -it --rm elasticsearch --version
Version: 5.0.1, Build: 080bb47/2016-11-11T22:08:49.812Z, JVM: 1.8.0_111
We are using version 5.0.1 currently. If you want to make sure that you use the exact same version as I have used in this blog, you can use the imagename elasticsearch:5.0.1 in all docker commands instead of elasticsearch only.
Step 3: Run Elasticsearch in interactive Terminal Mode
In this step, we will run Elasticsearch interactively (with -it switch instead of -d switch) to better see, what is happening (I had some memory issues, see Appendix A and B, which cannot be seen easily in detached mode):
(dockerhost)$ sudo docker run -it --rm --name elasticsearch -p9200:9200 -p9300:9300 --entrypoint bash elasticsearch
We have found out by analyzing the Elasticsearch image via the online imagelayer tool, that the default command is to run /docker-entrypoint.sh elasticsearch. Let us do that now. The output should look something like follows:
root@8e7170639d98:/usr/share/elasticsearch# /docker-entrypoint.sh elasticsearch
[2016-11-18T14:34:36,149][INFO ][o.e.n.Node               ] [] initializing ...
[2016-11-18T14:34:36,395][INFO ][o.e.e.NodeEnvironment    ] [iqF8643] using [1] data paths, mounts [[/usr/share/elasticsearch/data (/dev/dm-0)]], net usable_space [32.3gb], net total_space [38.2gb], spins? [possibly], types [ext4]
[2016-11-18T14:34:36,396][INFO ][o.e.e.NodeEnvironment    ] [iqF8643] heap size [1.9gb], compressed ordinary object pointers [true]
[2016-11-18T14:34:36,398][INFO ][o.e.n.Node               ] [iqF8643] node name [iqF8643] derived from node ID; set [node.name] to override
[2016-11-18T14:34:36,403][INFO ][o.e.n.Node               ] [iqF8643] version[5.0.1], pid[41], build[080bb47/2016-11-11T22:08:49.812Z], OS[Linux/4.2.0-42-generic/amd64], JVM[Oracle Corporation/OpenJDK 64-Bit Server VM/1.8.0_111/25.111-b14]
[2016-11-18T14:34:38,606][INFO ][o.e.p.PluginsService     ] [iqF8643] loaded module [aggs-matrix-stats]
[2016-11-18T14:34:38,607][INFO ][o.e.p.PluginsService     ] [iqF8643] loaded module [ingest-common]
[2016-11-18T14:34:38,607][INFO ][o.e.p.PluginsService     ] [iqF8643] loaded module [lang-expression]
[2016-11-18T14:34:38,607][INFO ][o.e.p.PluginsService     ] [iqF8643] loaded module [lang-groovy]
[2016-11-18T14:34:38,607][INFO ][o.e.p.PluginsService     ] [iqF8643] loaded module [lang-mustache]
[2016-11-18T14:34:38,608][INFO ][o.e.p.PluginsService     ] [iqF8643] loaded module [lang-painless]
[2016-11-18T14:34:38,608][INFO ][o.e.p.PluginsService     ] [iqF8643] loaded module [percolator]
[2016-11-18T14:34:38,608][INFO ][o.e.p.PluginsService     ] [iqF8643] loaded module [reindex]
[2016-11-18T14:34:38,608][INFO ][o.e.p.PluginsService     ] [iqF8643] loaded module [transport-netty3]
[2016-11-18T14:34:38,609][INFO ][o.e.p.PluginsService     ] [iqF8643] loaded module [transport-netty4]
[2016-11-18T14:34:38,610][INFO ][o.e.p.PluginsService     ] [iqF8643] no plugins loaded
[2016-11-18T14:34:39,104][WARN ][o.e.d.s.g.GroovyScriptEngineService] [groovy] scripts are deprecated, use [painless] scripts instead
[2016-11-18T14:34:42,833][INFO ][o.e.n.Node               ] [iqF8643] initialized
[2016-11-18T14:34:42,833][INFO ][o.e.n.Node               ] [iqF8643] starting ...
[2016-11-18T14:34:43,034][INFO ][o.e.t.TransportService   ] [iqF8643] publish_address {172.17.0.2:9300}, bound_addresses {[::]:9300}
[2016-11-18T14:34:43,040][INFO ][o.e.b.BootstrapCheck     ] [iqF8643] bound or publishing to a non-loopback or non-link-local address, enforcing bootstrap checks
[2016-11-18T14:34:43,839][INFO ][o.e.m.j.JvmGcMonitorService] [iqF8643] [gc][1] overhead, spent [434ms] collecting in the last [1s]
[2016-11-18T14:34:46,211][INFO ][o.e.c.s.ClusterService   ] [iqF8643] new_master {iqF8643}{iqF86430QRmm70Y5fDzVQw}{KsVmKueNQL6UBOMpiMsa5w}{172.17.0.2}{172.17.0.2:9300}, reason: zen-disco-elected-as-master ([0] nodes joined)
[2016-11-18T14:34:46,263][INFO ][o.e.h.HttpServer         ] [iqF8643] publish_address {172.17.0.2:9200}, bound_addresses {[::]:9200}
[2016-11-18T14:34:46,265][INFO ][o.e.n.Node               ] [iqF8643] started
[2016-11-18T14:34:46,276][INFO ][o.e.g.GatewayService     ] [iqF8643] recovered [0] indices into cluster_state
At this point the system is waiting for input on port 9200.
Step 4: Create sample Data
With the -p9200:9200 docker run option in the previous step, we have mapped the Docker container port 9200 to the Docker host port 9200. We now can send API calls to the Docker host’s port 9200.
Let us open a new terminal on the Docker host and type:
(dockerhost)$ curl -XPOST localhost:9200/twitter/tweed/1 -d '
{
"user": "oveits",
"message": "this is my first elasticsearch message",
"postDate": "2016-11-18T15:55:00"
}'
This will return a result like
{"_index":"twitter","_type":"tweed","_id":"1","_version":1,"result":"created","_shards":{"total":2,"successful":1,"failed":0},"created":true}
On the Elasticsearch terminal we see that a new index has been created with name „twitter“ a new mapping has been created with name „tweed“:
[2016-11-18T14:56:46,777][INFO ][o.e.c.m.MetaDataCreateIndexService] [iqF8643] [twitter] creating index, cause [auto(index api)], templates [], shards [5]/[1], mappings []
[2016-11-18T15:01:01,361][INFO ][o.e.c.m.MetaDataMappingService] [iqF8643] [twitter/p9whAy1-TeSVZbUbz-3VVQ] create_mapping [tweed]
Step 5: Read Data from the Database
We can read the data with a HTTP GET command:
curl -XGET localhost:9200/twitter/tweed/1
This will return
{"_index":"twitter","_type":"tweed","_id":"1","_version":1,"found":true,"_source":
{
"user": "oveits",
"message": "this is my first elasticsearch message",
"postDate": "2016-11-18T15:55:00"
}}
Let us send a second tweed a little bit later (postDate: 16:11 instead of 15:55):
(dockerhost)$ curl -XPOST localhost:9200/twitter/tweed/2 -d '
{
"user": "oveits",
"message": "this is my second message",
"postDate": "2016-11-18T16:11:00"
}'
curl -XPUT localhost:9200/twitter/tweed/2 -d '
{
"user": "oveits",
"message": "this is my second message",
"postDate": "2016-11-18T16:11:00"
}'
Step 6: Search Data based on Content
Now we will test some search capabilities of Elasticsearch. Let us search for all entries with a message that contains the string „elasticsearch“:
Step 6.1: Search String in Message
curl -XGET localhost:9200/twitter/_search?q=message:elasticsearch
This will return our first message only, since it contains the „elasticsearch“ string:
{"took":58,"timed_out":false,"_shards":{"total":5,"successful":5,"failed":0},"hits":{"total":1,"max_score":0.25316024,"hits":[{"_index":"twitter","_type":"tweed","_id":"1","_score":0.25316024,"_source":
{
"user": "oveits",
"message": "this is my first elasticsearch message",
"postDate": "2016-11-18T15:55:00"
}}]}}
Note that the answer contains a _source field with the full text of the data.
Step 6.2: Search String in any Field
We also can search for any field, if we remove the field name message: from the query, e.g.
$ curl -XGET localhost:9200/twitter/_search?q=2016
{"took":4,"timed_out":false,"_shards":{"total":5,"successful":5,"failed":0},"hits":{"total":2,"max_score":0.25316024,"hits":[{"_index":"twitter","_type":"tweed","_id":"1","_score":0.25316024,"_source":
{
"user": "oveits",
"message": "this is my first elasticsearch message",
"postDate": "2016-11-18T15:55:00"
}},{"_index":"twitter","_type":"tweed","_id":"2","_score":0.24257512,"_source":
{
"user": "oveits",
"message": "this is my second message",
"postDate": "2016-11-18T16:11:00"
The query has found both entries, since they both contain the string „2016“ in one of the fields.
Step 6.3: Search for Entries within a Time Range
We also can filter database entries based on a time range. The command
$ curl -XGET localhost:9200/twitter/_search? -d '
{ "query": { "range": { "postDate": { "from": "2016-11-18T15:00:00", "to": "2016-11-18T17:00:00" } } } }'
returns both entries while
$ curl -XGET localhost:9200/twitter/_search? -d '
{ "query": { "range": { "postDate": { "from": "2016-11-18T15:00:00", "to": "2016-11-18T16:00:00" } } } }'
returns the first entry only:
{ "query": { "range": { "postDate": { "from": "2016-11-18T15:00:00", "to": "2016-11-18T16:00:00" } } } }'
{"took":3,"timed_out":false,"_shards":{"total":5,"successful":5,"failed":0},"hits":{"total":1,"max_score":1.0,"hits":[{"_index":"twitter","_type":"tweed","_id":"1","_score":1.0,"_source":
{
"user": "oveits",
"message": "this is my first elasticsearch message",
"postDate": "2016-11-18T15:55:00"
}}]}}
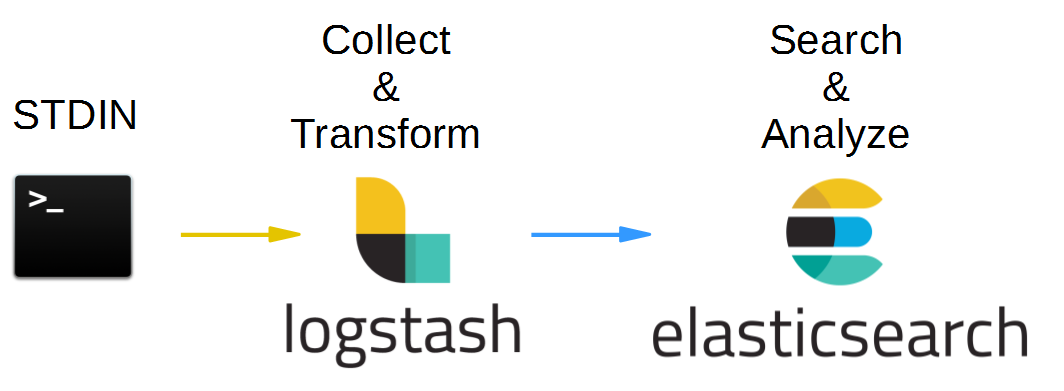
Step 7: Logstash als Input Source to Elasticsearch
Our final step for this Hello World post is to use Logstash as the data source for Elasticsearch. The target pipeline of this step is:
It does not really make a difference, but for simplicity of this demonstration, we will replace the input file by a command line STDIN input. We already have shown in the Logstash blog post that both input sources create the same results. This helps us reduce the number of needed terminals: we can use the Logstash terminal to add the data and there is no need to open a separate terminal for manipulation of the input file.
Note: For this step, make sure to have at least 500 MB memory left on your (Docker) host after starting Elasticsearch, e.g. by checking with
top. In my tests, I have created a Docker host VM with a total memory of 4 GB. I have seen Elasticsearch to occupy up to 2.9 GB, while Logstash may need another 0.5 GB.
On the Docker host, we create a configuration file logstash_to_elasticsearch.conf like follows:
#logstash_to_elasticsearch.conf
input {
  stdin { }
}

output {
  elasticsearch {
    action => "index"
    index => "logstash"
    hosts => "10.0.2.15"
    workers => 1
  }
  stdout { }
}
Here 10.0.2.15 ist the IP address of the Docker host (interface docker0). We have used STDIN and STDOUT for simplicity. This way, we can just type the input data into the Logstash terminal, similar to yesterday’s Logstash blog post like follows:
(dockerhost)$ sudo docker run -it --rm --name logstash -v "$PWD":/app --entrypoint bash logstash
And within the container we start Logstash with this configuration file:
(container)# logstash -f /app/logstash_to_elasticsearch.conf
...
18:43:58.751 [[main]-pipeline-manager] INFO  logstash.outputs.elasticsearch - Elasticsearch pool URLs updated {:changes=>{:removed=>[], :added=>["http://10.0.2.15:9200"]}}
In a second terminal on the Docker host, we clean the Elasticsearch database and verify that the database is empty by checking that the total number of entries is 0:
(dockerhost)$ curl -XDELETE 'http://localhost:9200/_all'
{"acknowledged":true}
(dockerhost)$ curl -XGET localhost:9200/_search
{"took":1,"timed_out":false,"_shards":{"total":0,"successful":0,"failed":0},"hits":{"total":0,"max_score":0.0,"hits":[]}}
Caution: this will delete all data in the database!
Now we type into the Logstash terminal:
This is a testlog<Enter>
In the Elasticsearch terminal, we see the log:
[2016-11-18T19:12:15,275][INFO ][o.e.c.m.MetaDataCreateIndexService] [kam5hQi] [logstash] creating index, cause [auto(bulk api)], templates [], shards [5]/[1], mappings []
[2016-11-18T19:12:15,422][INFO ][o.e.c.m.MetaDataMappingService] [kam5hQi] [logstash/TbRsmMiFRbuGyP_THANk3w] create_mapping [logs]
And with following command we can review the data Logstash has forwarded the data to Elasticsearch:
(dockerhost)$ curl -XGET localhost:9200/_search
{"took":4,"timed_out":false,"_shards":{"total":5,"successful":5,"failed":0},"hits":{"total":1,"max_score":1.0,"hits":[{"_index":"logstash","_type":"logs","_id":"AVh42oA25J6ZuRKS_qBB","_score":1.0,"_source":{"@timestamp":"2016-11-18T19:12:14.442Z","@version":"1","host":"adf58f139fd3","message":"This is a testlog","tags":[]}}]}}
Perfect! With that we have verified that data is sent from Logstash to Elasticsearch.
Appendix A: Error: Cannot allocate memory
This error has been seen by running Elasticsearch as a Docker container on a Docker host with only 250 MB RAM left (as seen with top).
(dockerhost) $
$ sudo docker run -it --rm elasticsearch --version
OpenJDK 64-Bit Server VM warning: INFO: os::commit_memory(0x000000008a660000, 1973026816, 0) failed; error='Cannot allocate memory' (errno=12)
#
# There is insufficient memory for the Java Runtime Environment to continue.
# Native memory allocation (mmap) failed to map 1973026816 bytes for committing reserved memory.
# An error report file with more information is saved as:
# /tmp/hs_err_pid1.log
Resolution:
A temporary resolution is to
- shut down the Vagrant Docker host via
vagrant halt
2. Open the Virtualbox console
3. Increase the memory by ~500 MB (right-click the VM on the left pane of the Virtualbox console -> change -> system -> increase memory)
4. Start Vagrant Docker host via
vagrant up
A permanent solution is to
- increase the value of vb.memory in the Vagrantfile line, e.g.
vb.memory = "1536"
by
vb.memory = "4096"
With that, next time a Virtualbox VM is created by Vagrant, the new value will be used. Also I have seen that the reboot has freed up quite some resources…
Appendix B: vm.max_map_count too low
The Elasticsearch application requires a minimum vm.max_map_count of 262144. See the official documentation for details. If this minimum requirement is not met, we see following log during startup of Elasticsearch:
$ sudo docker run -it --rm --name elasticsearch -p9200:9200 -p9300:9300 elasticsearch
[2016-11-18T13:29:35,124][INFO ][o.e.n.Node ] [] initializing ...
[2016-11-18T13:29:35,258][INFO ][o.e.e.NodeEnvironment ] [SfJmZdJ] using [1] data paths, mounts [[/usr/share/elasticsearch/data (/dev/dm-0)]], net usable_space [32.3gb], net total_space [38.2gb], spins? [possibly], types [ext4]
[2016-11-18T13:29:35,258][INFO ][o.e.e.NodeEnvironment ] [SfJmZdJ] heap size [1.9gb], compressed ordinary object pointers [true]
[2016-11-18T13:29:35,261][INFO ][o.e.n.Node ] [SfJmZdJ] node name [SfJmZdJ] derived from node ID; set [node.name] to override
[2016-11-18T13:29:35,267][INFO ][o.e.n.Node ] [SfJmZdJ] version[5.0.1], pid[1], build[080bb47/2016-11-11T22:08:49.812Z], OS[Linux/4.2.0-42-generic/amd64], JVM[Oracle Corporation/OpenJDK 64-Bit Server VM/1.8.0_111/25.111-b14]
[2016-11-18T13:29:37,449][INFO ][o.e.p.PluginsService ] [SfJmZdJ] loaded module [aggs-matrix-stats]
[2016-11-18T13:29:37,450][INFO ][o.e.p.PluginsService ] [SfJmZdJ] loaded module [ingest-common]
[2016-11-18T13:29:37,451][INFO ][o.e.p.PluginsService ] [SfJmZdJ] loaded module [lang-expression]
[2016-11-18T13:29:37,452][INFO ][o.e.p.PluginsService ] [SfJmZdJ] loaded module [lang-groovy]
[2016-11-18T13:29:37,452][INFO ][o.e.p.PluginsService ] [SfJmZdJ] loaded module [lang-mustache]
[2016-11-18T13:29:37,453][INFO ][o.e.p.PluginsService ] [SfJmZdJ] loaded module [lang-painless]
[2016-11-18T13:29:37,455][INFO ][o.e.p.PluginsService ] [SfJmZdJ] loaded module [percolator]
[2016-11-18T13:29:37,455][INFO ][o.e.p.PluginsService ] [SfJmZdJ] loaded module [reindex]
[2016-11-18T13:29:37,456][INFO ][o.e.p.PluginsService ] [SfJmZdJ] loaded module [transport-netty3]
[2016-11-18T13:29:37,456][INFO ][o.e.p.PluginsService ] [SfJmZdJ] loaded module [transport-netty4]
[2016-11-18T13:29:37,457][INFO ][o.e.p.PluginsService ] [SfJmZdJ] no plugins loaded
[2016-11-18T13:29:37,807][WARN ][o.e.d.s.g.GroovyScriptEngineService] [groovy] scripts are deprecated, use [painless] scripts instead
[2016-11-18T13:29:43,310][INFO ][o.e.n.Node ] [SfJmZdJ] initialized
[2016-11-18T13:29:43,310][INFO ][o.e.n.Node ] [SfJmZdJ] starting ...
[2016-11-18T13:29:43,716][INFO ][o.e.t.TransportService ] [SfJmZdJ] publish_address {172.17.0.3:9300}, bound_addresses {[::]:9300}
[2016-11-18T13:29:43,725][INFO ][o.e.b.BootstrapCheck ] [SfJmZdJ] bound or publishing to a non-loopback or non-link-local address, enforcing bootstrap checks
ERROR: bootstrap checks failed
max virtual memory areas vm.max_map_count [65530] is too low, increase to at least [262144]
[2016-11-18T13:29:43,741][INFO ][o.e.n.Node ] [SfJmZdJ] stopping ...
[2016-11-18T13:29:43,763][INFO ][o.e.n.Node ] [SfJmZdJ] stopped
[2016-11-18T13:29:43,764][INFO ][o.e.n.Node ] [SfJmZdJ] closing ...
[2016-11-18T13:29:43,791][INFO ][o.e.n.Node ] [SfJmZdJ] closed
Resolution:
Temporary solution:
(dockerhost) $ sudo sysctl -w vm.max_map_count=262144
and reboot the system.
Permanent solution on LINUX hosts:
Update the vm.max_map_count setting to 262144 or more in /etc/sysctl.conf. To verify after rebooting, run sysctl vm.max_map_count.
Permanent solution for future Vagrant-created LINUX hosts:
In case we use Vagrant to create Linux VMs, we also need to make sure the next VM is created with the correct vm.max_map_count setting. For that, we can run a startup.sh file like described here:
In the Vagrantfile we set:
config.vm.provision :file, :source => "elasticsearchpreparation.sh", :destination => "/tmp/elasticsearchpreparation.sh"
config.vm.provision :shell, :inline => "sudo sed -i 's/\r//g' /tmp/elasticsearchpreparation.sh && chmod +x /tmp/elasticsearchpreparation.sh && /tmp/elasticsearchpreparation.sh", :privileged => true
with the file elasticsearchpreparation.sh:
#!/usr/bin/env bash
# file: elasticsearchpreparation.sh
sudo sysctl -w vm.max_map_count=262144
ulimit -n 65536
The sed and chmod commands make sense on Windows hosts in order to make sure the file has UNIX format and and has the required rights. Also here, make sure to run sysctl vm.max_map_count in order to check, that the configuration is active (might require a reboot).
Summary
In this blog post we have performed following Hello World tasks:
- we have fed Elasticsearch with JSON style data using simple CURL commands
- we have shown how to read and search data by full text search and by time range
- we have shown how Logstash can be used as the data source to feed data into the Elasticsearch database
In order to avoid any compatibility issues with the java version on the host, we have run both, Elasticsearch and Logstash in Docker containers. In order to better see what happens under the hood, we have chosen Docker containers in interactive terminal mode. In the course of the tests, we had hit two Memory resource issues: too low memory and too low number of mapped memory areas. Those issues and their workarounds/solutions are described in Appendix A and B.
References
- The Elasticsearch Twitter examples can be found in this youtube video.
- A simple Logstash hello world for output to Elasticsearch can be found on Kevin Kirsche’s Blog (with a tiny typo on the configuration file: is must be „hosts“ instead of „host“)
- Logstash „Hello World“ blog post with Docker Containers.