![]() Today, we will introduce Kibana, a data visualization open source tool. As part of Elastic’s ELK stack (now called Elastic stack), Kibana is often used to visualize logging statistics and for management of the Elastic Stack. However, in this Tutorial, we will analyze statistical data from Twitter by comparing the popularity of Trump vs. Obama vs. Clinton.
Today, we will introduce Kibana, a data visualization open source tool. As part of Elastic’s ELK stack (now called Elastic stack), Kibana is often used to visualize logging statistics and for management of the Elastic Stack. However, in this Tutorial, we will analyze statistical data from Twitter by comparing the popularity of Trump vs. Obama vs. Clinton.
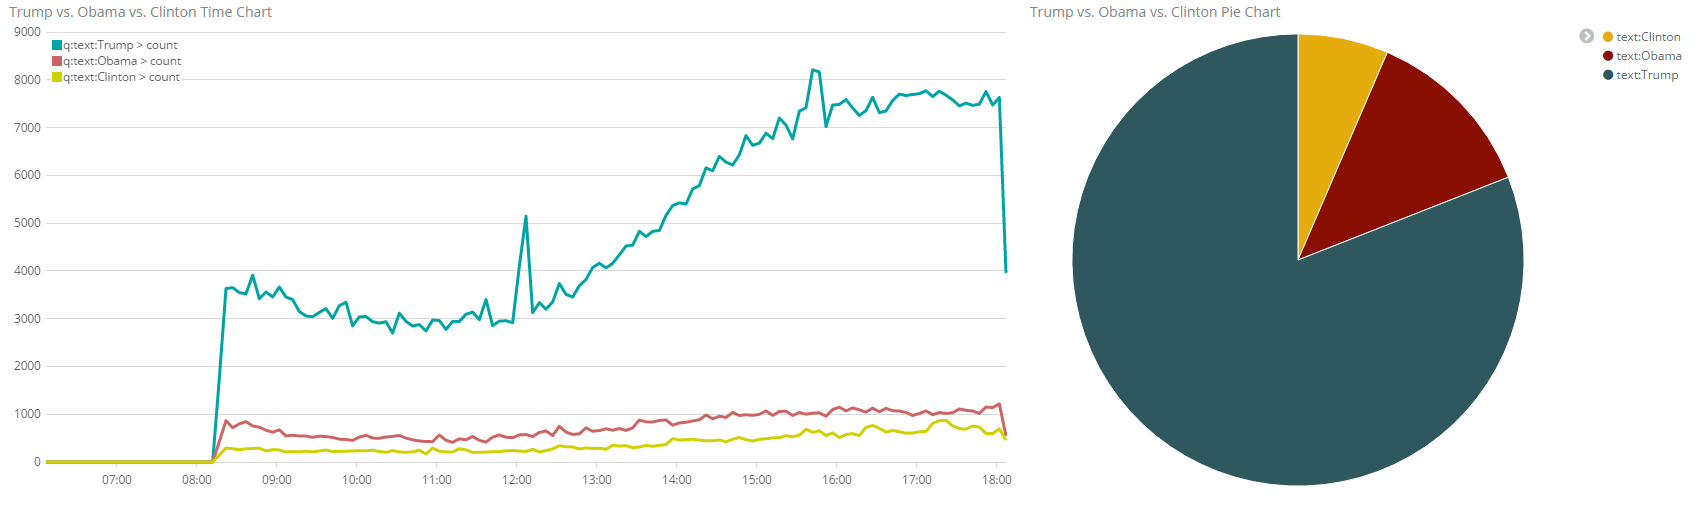
For that, we will attach Logstash to the Twitter API and feed the data to Elasticsearch. Kibana will visualize the Elasticsearch data in a pie chart and a data time histogram. At the end, we will see, that Trump wins this little Twitter tweet count contest by far: he is mentioned in Twitter tweets about 20 times as often as Obama and Clinton together:
But now let us get back to the technology topics.
This is the third blog post of a series about the Elastic Stack (a.k.a. ELK stack):
- Part 1: Logstash „Hello World“ Example shows how to collect and translate log data with Logstash 5
- Part 2: Elasticsearch „Hello World“ Example introduces Elasticsearch 5 for big data analysis applied to Logstash-collected data
- Part 3: Kibana „Hello World“ Example (this blog) introduces Kibana 5 for data visualization and binds Logstash, Elasticsearch and Kibana together
What is Kibana?
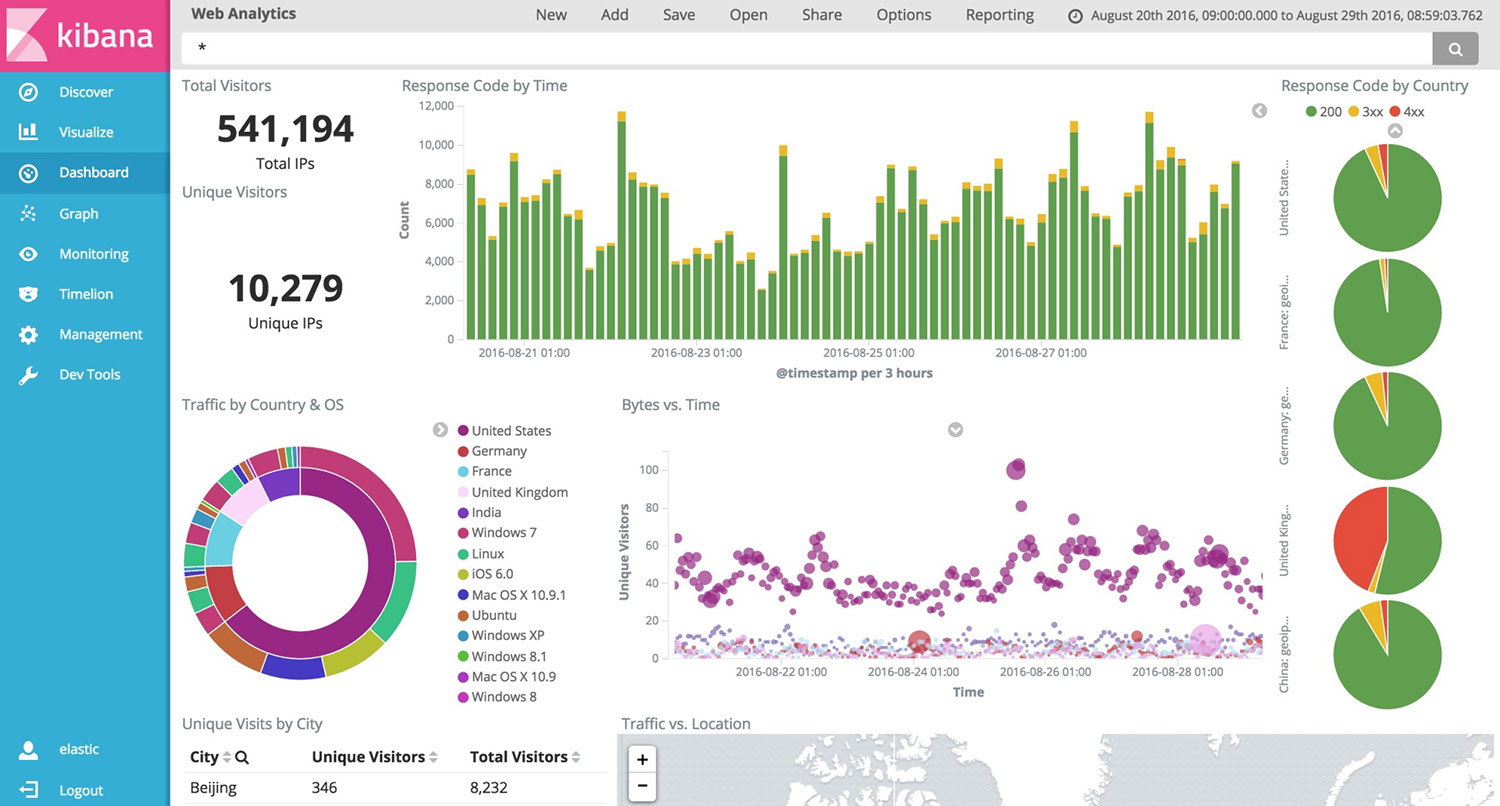
Kibana is a tool for visualization of logging statistics stored in the Elasticsearch database. Statistical graphs like histograms, line graphs, pie charts, sunbursts are core capabilities of Kibana.
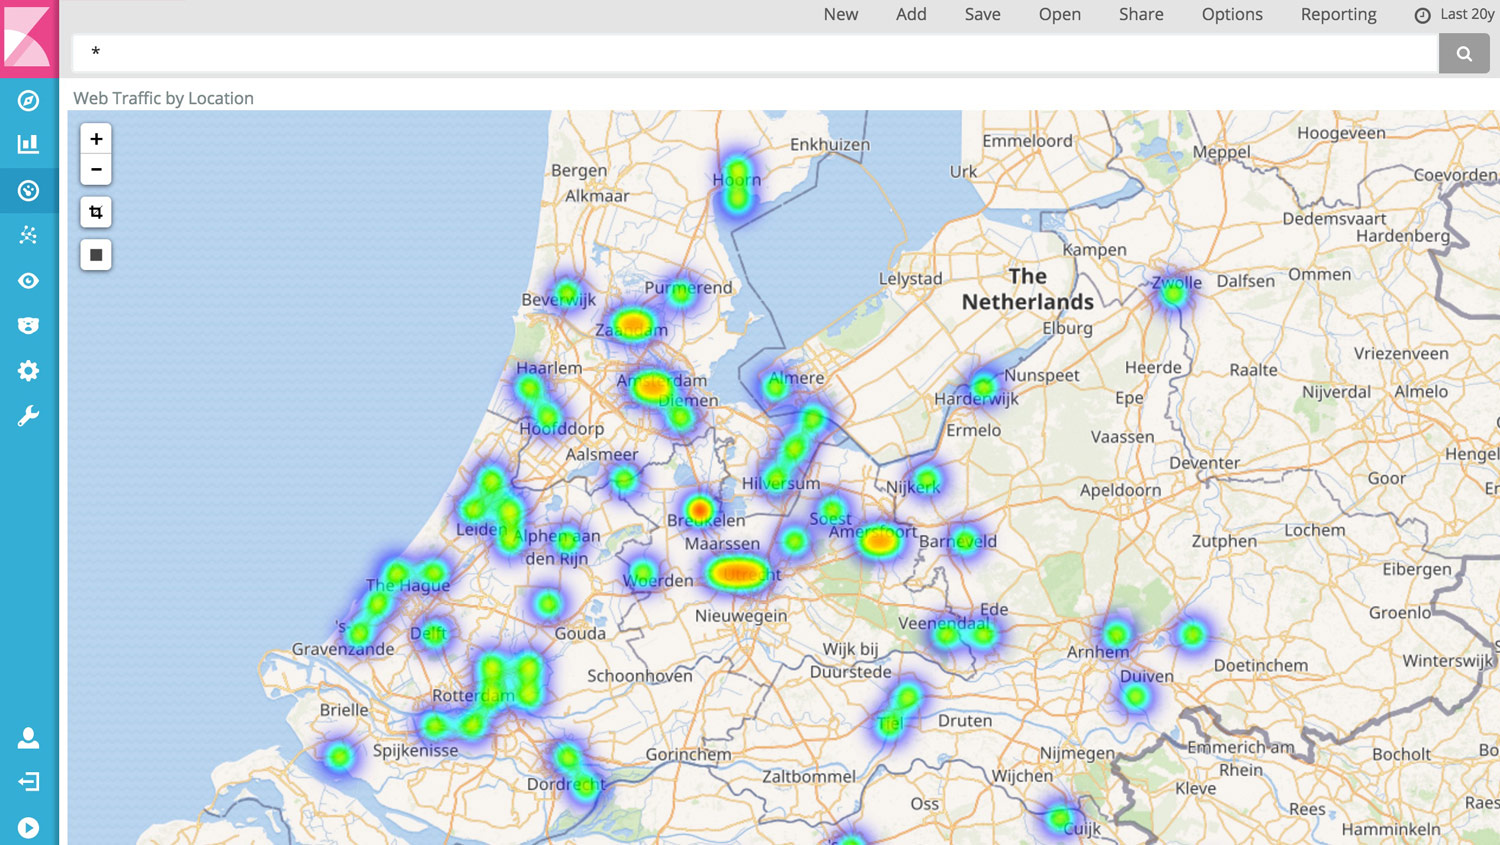
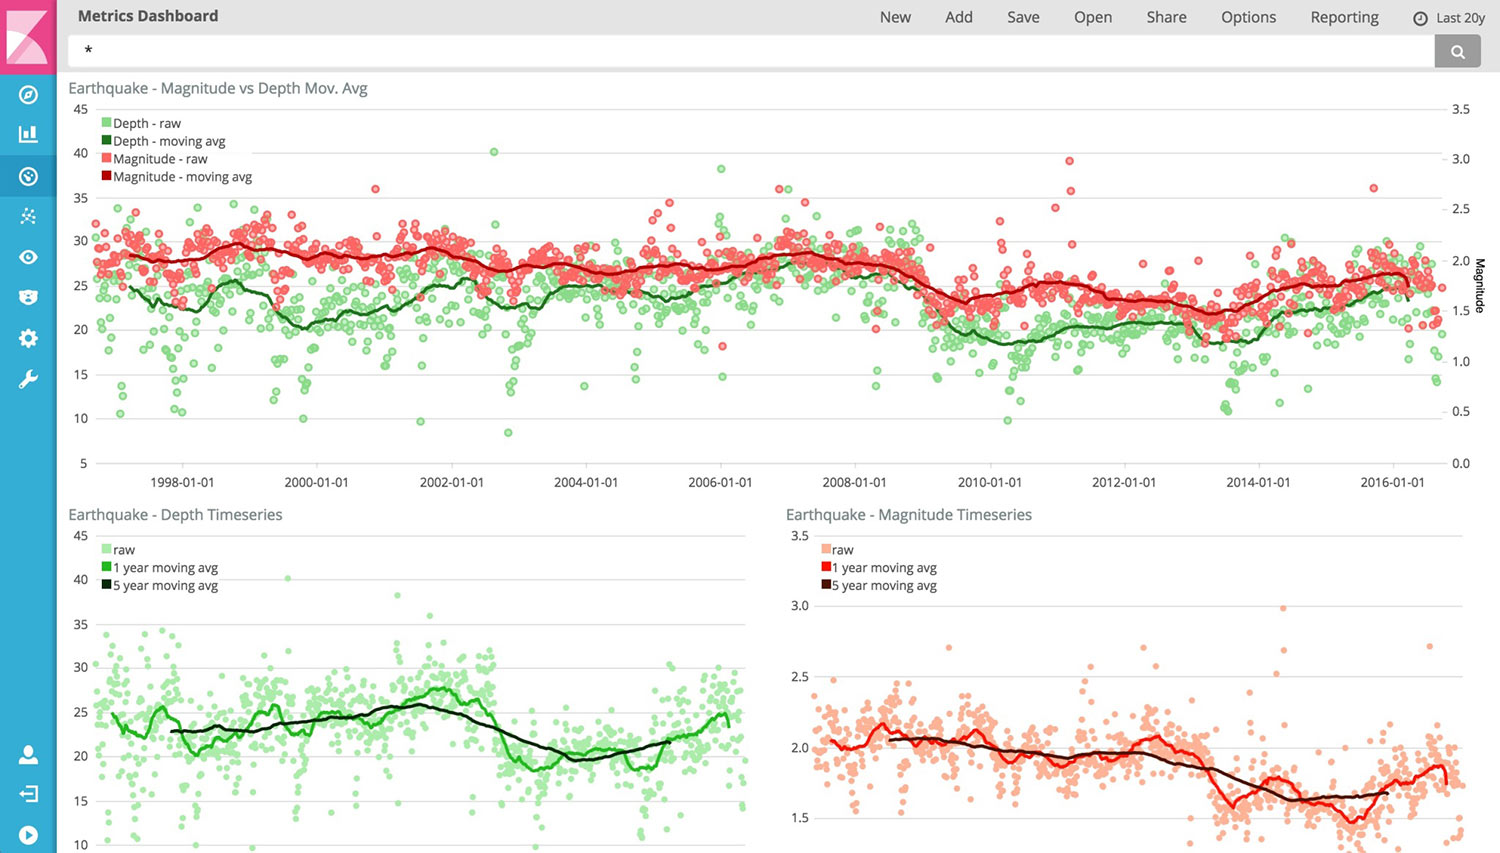
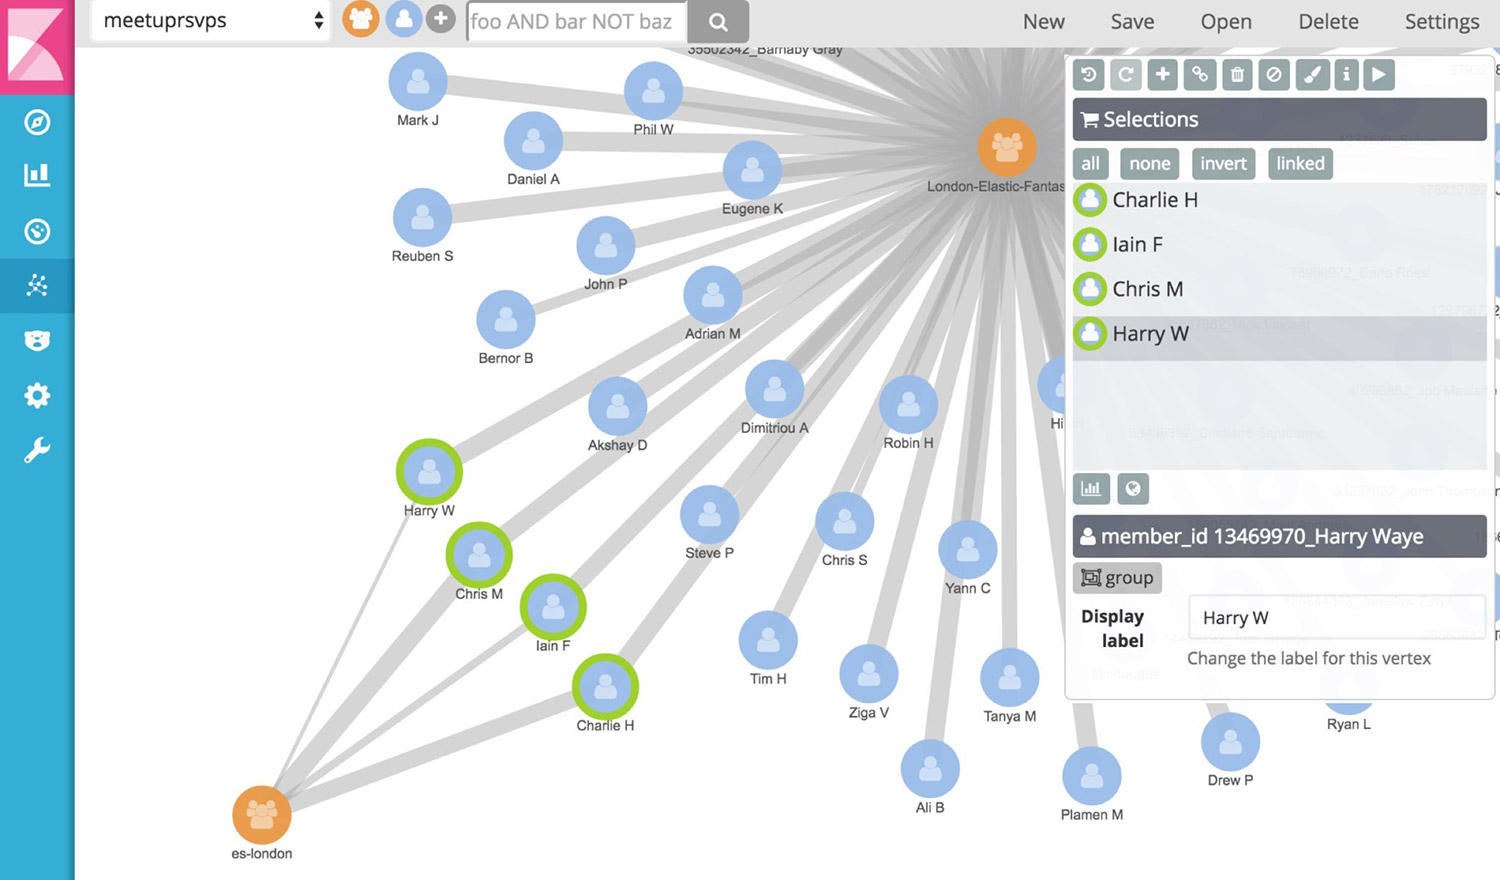
In addition, Logstash’s and Elasticsearch’s capabilites allow it to visualize statistical data on a geographical map. And with tools like Timelion and Graph, an administrator can analyze time-series and relationships, respectively:
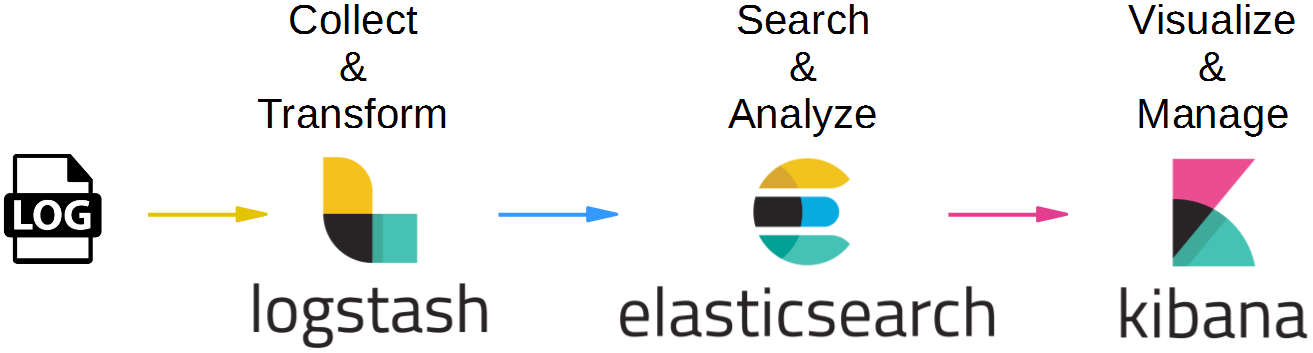
Kibana is often used in the so-called ELK pipeline for log file collection, analysis and visualization:
- Elasticsearch is for searching, analyzing, and storing your data
- Logstash (and Beats) is for collecting and transforming data, from any source, in any format
- Kibana is a portal for visualizing the data and to navigate within the elastic stack
Target Configuration for this Blog Post
In this Hello World blog post, we will use simple HTTP Verbs towards the RESTful API of Elasticsearch to create, read and destroy data entries:

As a second step, we will attach Logstash to Twitter and Elasticsearch, whose data will be visualized in Kibana. Apart from the data source on the left, this is the same as the usual ELK pipeline:
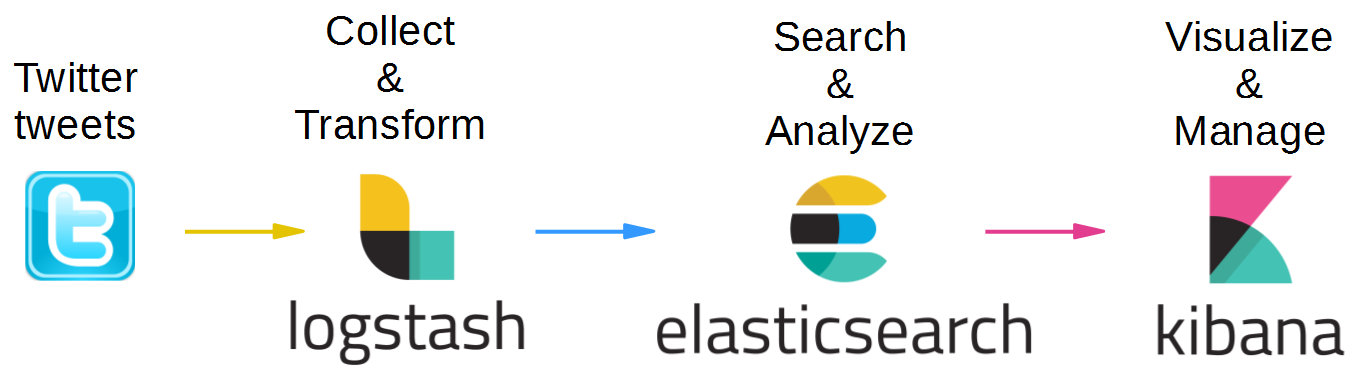
This will allow us to analyze the number of Twitter tweets with certain keywords in the text.
Tools used
- Vagrant 1.8.6
- Virtualbox 5.0.20
- Docker 1.12.1
- Logstash 5.0.1
- Elasticsearch 5.0.1
- Kibana 5.0.1
Prerequisites:
- DRAM >~ 4GB
- The max virtual memory areas vm.max_map_count must be at least 262144, see this note on the official documentation.
See also Appendix B below, how to set the value on Linux temporarily, permanently and also for the next Vagrant-created Linux VM.
Step 1: Install a Docker Host via Vagrant and Connect to the Host via SSH
If you are using an existing docker host, make sure that your host has enough memory and your own Docker ho
We will run Kibana, Elasticstack and Logstash in Docker containers in order to allow for maximum interoperability. This way, we always can use the latest Logstash version without the need to control the java version used: e.g. Logstash v 1.4.x works with java 7, while version 5.0.x works with java 8 only, currently.
If you are new to Docker, you might want to read this blog post.
Installing Docker on Windows and Mac can be a real challenge, but no worries: we will show an easy way here, that is much quicker than the one described in Docker’s official documentation:
Prerequisites of this step:
- I recommend to have direct access to the Internet: via Firewall, but without HTTP proxy. However, if you cannot get rid of your HTTP proxy, read this blog post.
- Administration rights on you computer.
Steps to install a Docker Host VirtualBox VM:
Download and install Virtualbox (if the installation fails with error message „Oracle VM Virtualbox x.x.x Setup Wizard ended prematurely“ see Appendix A of this blog post: Virtualbox Installation Workaround below)
1. Download and Install Vagrant (requires a reboot)
2. Download Vagrant Box containing an Ubuntu-based Docker Host and create a VirtualBox VM like follows:
basesystem# mkdir ubuntu-trusty64-docker ; cd ubuntu-trusty64-docker
basesystem# vagrant init williamyeh/ubuntu-trusty64-docker
basesystem# vagrant up
basesystem# vagrant ssh
Now you are logged into the Docker host and we are ready for the next step: to create the Ansible Docker image.
Note: I have experienced problems with the vi editor when running
vagrant sshin a Windows terminal. In case of Windows, consider to follow Appendix C of this blog post and to use putty instead.
Step 2 (optional): Download Kibana Image
This extra download step is optional, since the Kibana Docker image will be downloaded automatically in step 3, if it is not already found on the system:
(dockerhost)$ docker pull kibana
Using default tag: latest
latest: Pulling from library/kibana

386a066cd84a: Already exists
9ca92df3a376: Pull complete
c04752ac6b44: Pull complete
7bfecbcf70ff: Pull complete
f1338b2c8ead: Pull complete
bfe1da400856: Pull complete
cf0b2da1d7f9: Pull complete
aeaada72e01d: Pull complete
0162f4823d8e: Pull complete
Digest: sha256:c75dbca9c774887a3ab778c859208db638fde1a67cfa48aad703ac8cc94a793d
Status: Downloaded newer image for kibana:latest
The version of the downloaded Kibana image can be checked with following command:
(dockerhost)$ sudo docker run -it --rm kibana --version
5.0.1
We are using version 5.0.1 currently. If you want to make sure that you use the exact same version as I have used in this blog, you can use the imagename kibana:5.0.1 in all docker commands instead of kibana only.
Step 3: Start Elasticsearch
Kibana relies on the data stored and analyzed in Elasticsearch, so let us start that one first. Like in the Elasticsearch blog post, we run Elasticsearch interactively:
(dockerhost)$ sudo docker run -it --rm --name elasticsearch -p9200:9200 -p9300:9300 --entrypoint bash elasticsearch
(elasticsearchcontainer)# /docker-entrypoint.sh elasticsearch
After successful start, Elasticsearch is waiting for data.
Step 4: Start Logstash and use Twitter as Data Source
For this demonstration, it is good to have a lot of data we can analyze. Why not using Twitter as data source and look for tweets about Obama, Trump or Clinton? For that, let us create a file logstash_twitter.conf on the Docker host in the directory we will start the Logstash container from:
# logstash_twitter.conf
input {
  twitter {
    consumer_key => "consumer_key"
    consumer_secret => "consumer_secret"
    oauth_token => "oauth_token"
    oauth_token_secret => "oauth_token_secret"
    keywords => [ "Obama", "Trump", "Clinton" ]
    full_tweet => true
  }
}

output {
 stdout { codec => dots }
 elasticsearch {
 action => "index"
 index => "twitter"
 hosts => "elasticsearch"
 document_type => "tweet"
 template => "/app/twitter_template.json"
 template_name => "twitter"
 workers => 1
 }
}
But how do you find your personal consumer_key, etc? For that, you need a Twitter account, log in and create a new app on https://apps.twitter.com/.
Note: this works only, if you have registered your mobile phone with the Twitter account on Profile -> Settings -> Mobile Phone. The Website must have a valid URL format, even if you add a dummy address there.
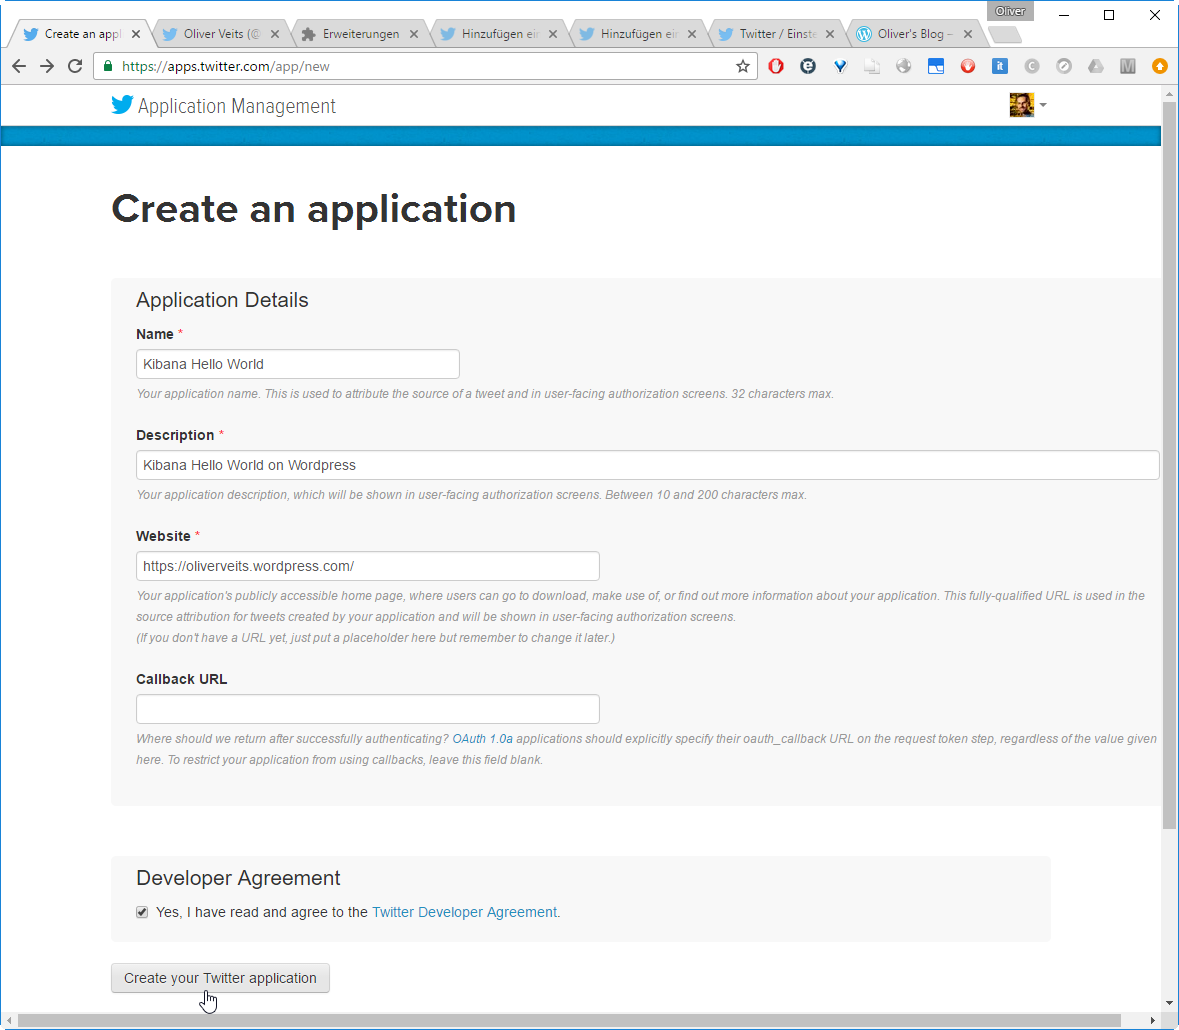
The consumer key and secret can be accessed on the „Keys and Access Tokens“ tab of the page you are redirected to. We do not want to send any tweets, so we can set the Access Level to „Read only“. Then, on the „Keys and Access Tokens“ tab again, create an access token by clicking the button at the bottom of the page. Then copy and paste the keys to the configuration file logstash_twitter.conf we have created above.
Now we need to download the template file twitter_template.json that logstash_twitter.conf is referring to (found here on the elasticstack/examples GIT repository of this blog post and on this GIT repository)
(dockerhost)$ curl -JO https://raw.githubusercontent.com/elastic/examples/master/ElasticStack_twitter/twitter_template.json
The content of the file is:
{
  "template": "twitter_elastic_example",
  "settings": {
    "number_of_shards": 1,
    "number_of_replicas": 0
  },
  "mappings": {
    "_default_": {
      "_all": {
        "enabled": true
      },
      "properties": {
        "@timestamp": {
          "type": "date",
          "format": "dateOptionalTime"
        },
        "text": {
          "type": "text"
        },
        "user": {
          "type": "object",
          "properties": {
            "description": {
              "type": "text"
            }
          }
        },
        "coordinates": {
          "type": "object",
          "properties": {
            "coordinates": {
              "type": "geo_point"
            }
          }
        },
        "entities": {
          "type": "object",
          "properties": {
            "hashtags": {
              "type": "object",
              "properties": {
                "text": {
                  "type": "text",
                  "fielddata": true
                }
              }
            }
          }
        },
        "retweeted_status": {
          "type": "object",
          "properties": {
            "text": {
              "type": "text"
            }
          }
        }
      },
      "dynamic_templates": [
        {
          "string_template": {
            "match": "*",
            "match_mapping_type": "string",
            "mapping": {
              "type": "keyword"
            }
          }
        }
      ]
    }
  }
}
With that, we are ready to start a Logstash Docker container with a link to the Elasticsearch container and start the Logstash process using of the configuration file we have created above:
(dockerhost)$ sudo docker run -it --rm --name logstash --link elasticsearch -v "$PWD":/app --entrypoint bash logstash
(logstash-container)# logstash -f /app/logstash_twitter.conf
In my case, I get many warnings in the Logstash terminal like
...............................20:05:52.220 [[main]>worker0] WARN logstash.outputs.elasticsearch - Failed action. {:status=>400, :action=>["index", {:_id=>nil, :_index=>"twitter", :_type=>"tweet", :_routing=>nil}, 2016-11-19T20:05:51.000Z %{host} %{message}], :response=>{"index"=>{"_index"=>"twitter", "_type"=>"tweet", "_id"=>"AVh-MfEl713eVTPkwAuA", "status"=>400, "error"=>{"type"=>"illegal_argument_exception", "reason"=>"Limit of total fields [1000] in index [twitter] has been exceeded"}}}}and in the Elasticsearch terminal like
[2016-11-19T20:49:43,874][WARN ][o.e.d.i.m.StringFieldMapper$TypeParser] The [string] field is deprecated, please use [text] or [keyword] instead on [id_str]
[2016-11-19T20:49:43,874][WARN ][o.e.d.i.m.StringFieldMapper$TypeParser] The [string] field is deprecated, please use [text] or [keyword] instead on [raw]
However, the many dots in the Logstash terminal show that a high number of tweets is recorded continuously. Let us ignore the warnings for now (they appear also, if logstash is started without any template, so it looks like bugs in the current version of the Elastic stack) and let us check the number of recorded tweeds from the Docker host:
(dockerhost)$ curl -XGET localhost:9200/twitter/_count
{"count":115,"_shards":{"total":1,"successful":1,"failed":0}}
(dockerhost)$ curl -XGET localhost:9200/twitter/_count
{"count":253,"_shards":{"total":1,"successful":1,"failed":0}}
The number of tweets is rising quickly. While performing the next steps, we keep Logstash and Elasticsearch running, so we have a good amount of data entries to work with.
Step 5: Run Kibana in interactive Terminal Mode
In this step, we will run Kibana interactively (with -it switch instead of -d switch) to better see, what is happening (in the Elasticsearch blog post, I had some memory issues, which cannot be seen easily in detached mode).
Similar to Logstash, we start Kibana with a link to the Elasticsearch container:
(dockerhost)$ sudo docker run -it --rm --name kibana -p5601:5601 --link elasticsearch --entrypoint bash kibana
We have found out by analyzing the Kibana image via the online imagelayer tool, that the default command is to run /docker-entrypoint.sh kibana. Let us do that now:
root@f13588d10379:/# /docker-entrypoint.sh kibana
[WARN  tini (5)] Tini is not running as PID 1 and isn't registered as a child subreaper.
        Zombie processes will not be re-parented to Tini, so zombie reaping won't work.
        To fix the problem, use -s or set the environment variable TINI_SUBREAPER to register Tini as a child subreaper, or run Tini as PID 1.
  log   [16:28:02.791] [info][status][plugin:kibana@5.0.1] Status changed from uninitialized to green - Ready
  log   [16:28:02.842] [info][status][plugin:elasticsearch@5.0.1] Status changed from uninitialized to yellow - Waiting for Elasticsearch
  log   [16:28:02.867] [info][status][plugin:console@5.0.1] Status changed from uninitialized to green - Ready
  log   [16:28:03.074] [info][status][plugin:timelion@5.0.1] Status changed from uninitialized to green - Ready
  log   [16:28:03.080] [info][listening] Server running at http://0.0.0.0:5601
  log   [16:28:03.085] [info][status][ui settings] Status changed from uninitialized to yellow - Elasticsearch plugin is yellow
  log   [16:28:08.118] [info][status][plugin:elasticsearch@5.0.1] Status changed from yellow to yellow - No existing Kibana index found
  log   [16:28:08.269] [info][status][plugin:elasticsearch@5.0.1] Status changed from yellow to green - Kibana index ready
  log   [16:28:08.270] [info][status][ui settings] Status changed from yellow to green - Ready
If you see errors at this point, refer to Appendix C.
Step 6: Open Kibana in a Browser
Now we want to connect to the Kibana portal. For that, open a browser and open the URL
<your_kibana_host>:5601
In our case, Kibana is running in a container and we have mapped the container-port 5601 to the local port 5601 of the Docker host. On the Docker host, we can open the URL.
localhost:5601
Note: In case of Vagrant with VirtualBox, per default, there is only a NAT-based interface and you need to create port-forwarding for any port you want to reach from outside (also the local machine you are working on is to be considered as outside). In this case, we need to add an entry in the port forwarding list of VirtualBox:
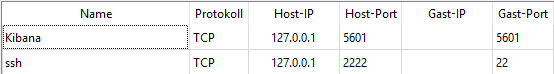
The Kibana dashboard will open:
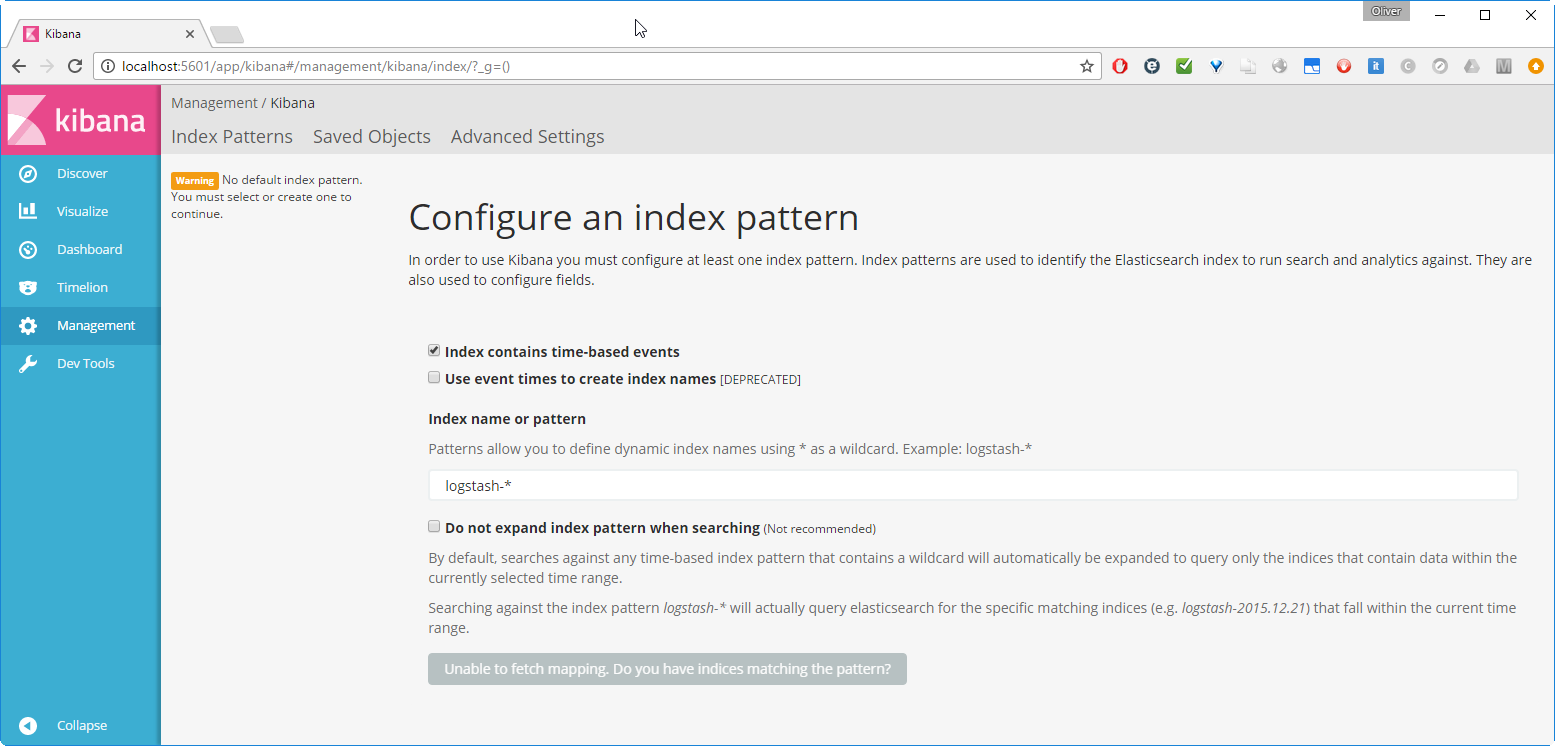
We change the index name pattern logstash-* by twitter and press Create.
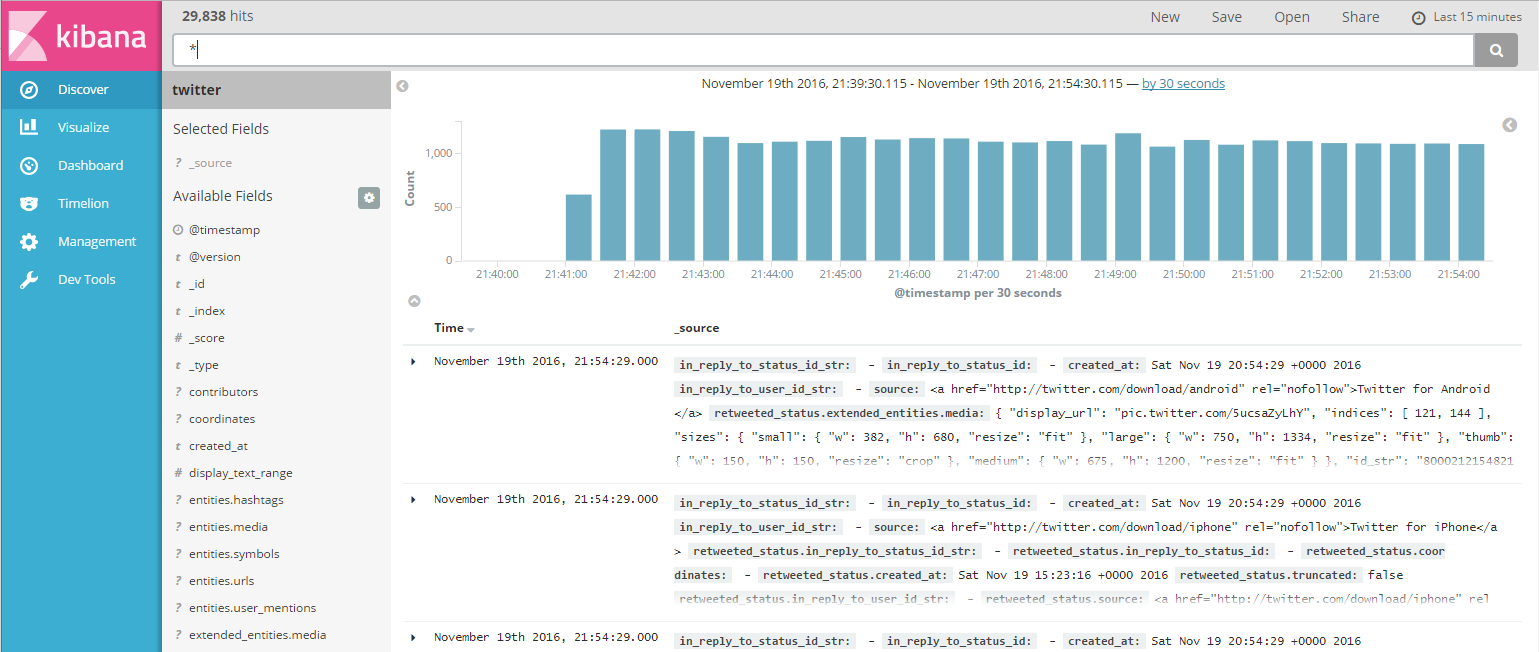
After clicking ![]() in the left pane, Kibana displays a time/date histogram of the total tweet count recorded, the fields received, and a list of the tweets:
in the left pane, Kibana displays a time/date histogram of the total tweet count recorded, the fields received, and a list of the tweets:
Now let us compare the popularity of Obama vs. Trump. On the Docker host, we can test a query like follows:
(dockerhost)$ curl -XGET localhost:9200/twitter/tweet/_count?q=text:Obama
{"count":2046,"_shards":{"total":1,"successful":1,"failed":0}}
(dockerhost)$ curl -XGET localhost:9200/twitter/tweet/_count?q=text:Trump
{"count":9357,"_shards":{"total":1,"successful":1,"failed":0}}
(dockerhost)$ curl -XGET localhost:9200/twitter/tweet/_count?q=text:Clinton
{"count":747,"_shards":{"total":1,"successful":1,"failed":0}}
Okay, we already can see, who the winner of this little Twitter contest is: Trump. Let us analyze the data a little bit more in detail. For that, we can place the tested query into the query field:
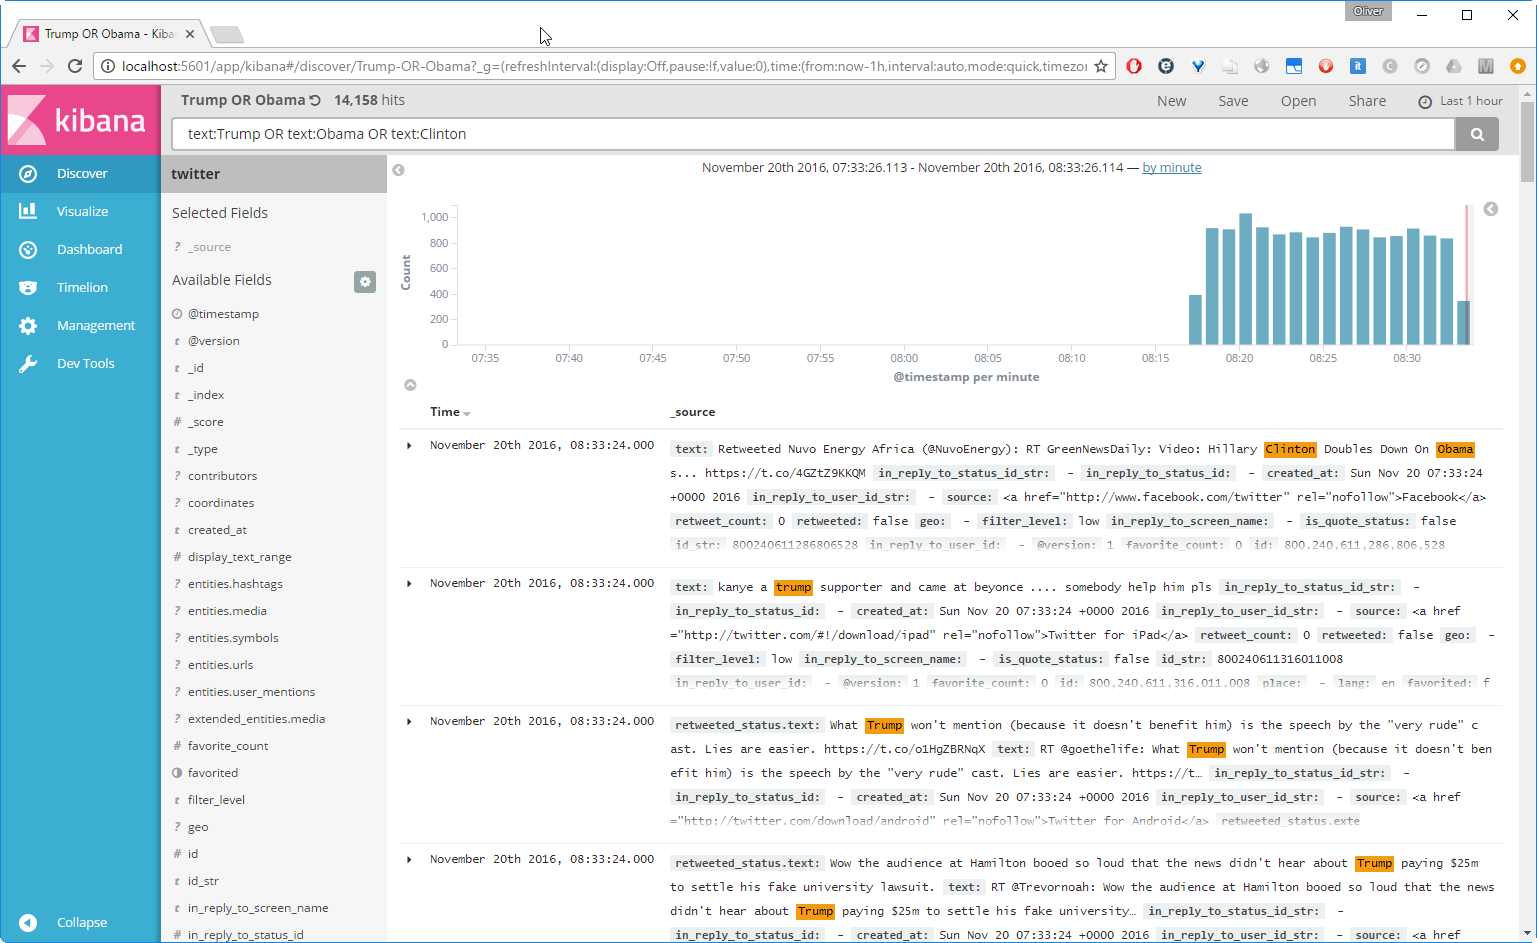
All matching entries are listed, and the matching strings are highlighted. Let us press Save and give it the name „Trump OR Obama OR Clinton“.
Step 6: Create a Pie Chart
Now let us visualize the data. Press on Visualize link in the left pane, choose pie chart

and choose the „Trump OR Obama OR Clinton“ query from the Saved Searches on the right pane. We are shown a very simple pie chart:
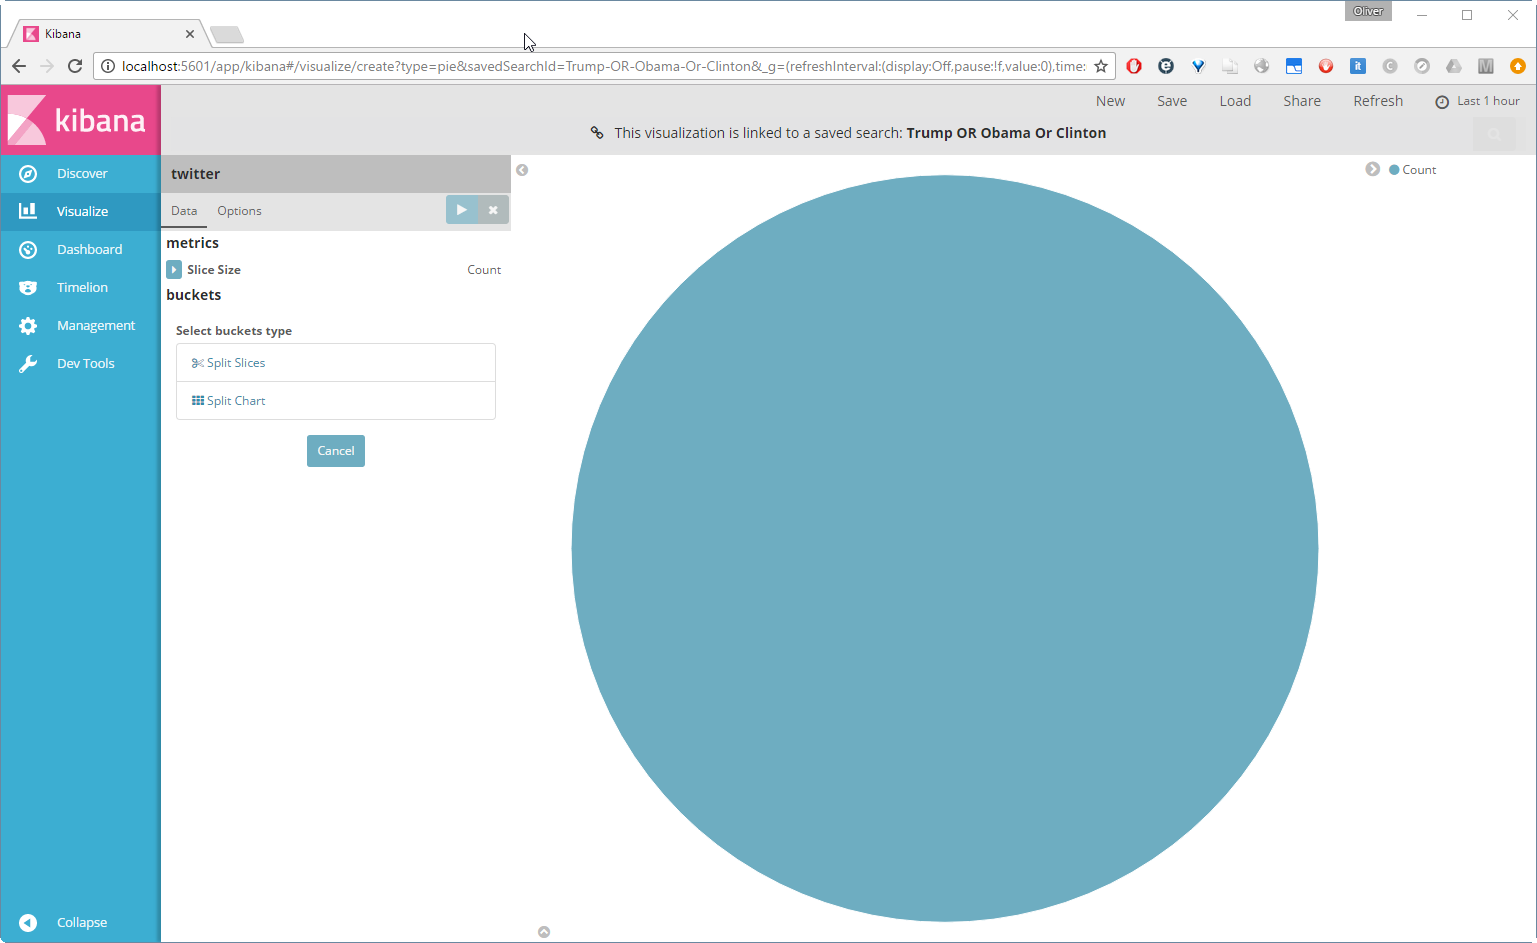
This is not so interesting yet. Let us now click Split Slices, choose the Filter Aggregation and add the query text:Trump. Then ![]() and
and text:Obama. The same for Clinton. After that press the white on blue triangle ![]() to apply the changes. That looks better now.
to apply the changes. That looks better now.

Let us save this as „Trump vs. Obama vs. Clinton Pie Chart“.
Step 7: Create a Time Chart
Now we want to visualize, how the popularity of the three politicians change over time. For a single query, this can be done with a Line Chart and using Visualize -> Line Chart -> choose the query -> and choose the X-Axis Aggregation Date Histogram. However, this is not, what we want to achieve:

We would like to display all three queries in a single graph, and this requires the usage of the Timelion plugin.
So, click on Timelion link on the left pane, then add the query .es('text:Trump'), .es('text:Obama'), .es(text:Clinton) on the top. This will create the chart we were looking for:
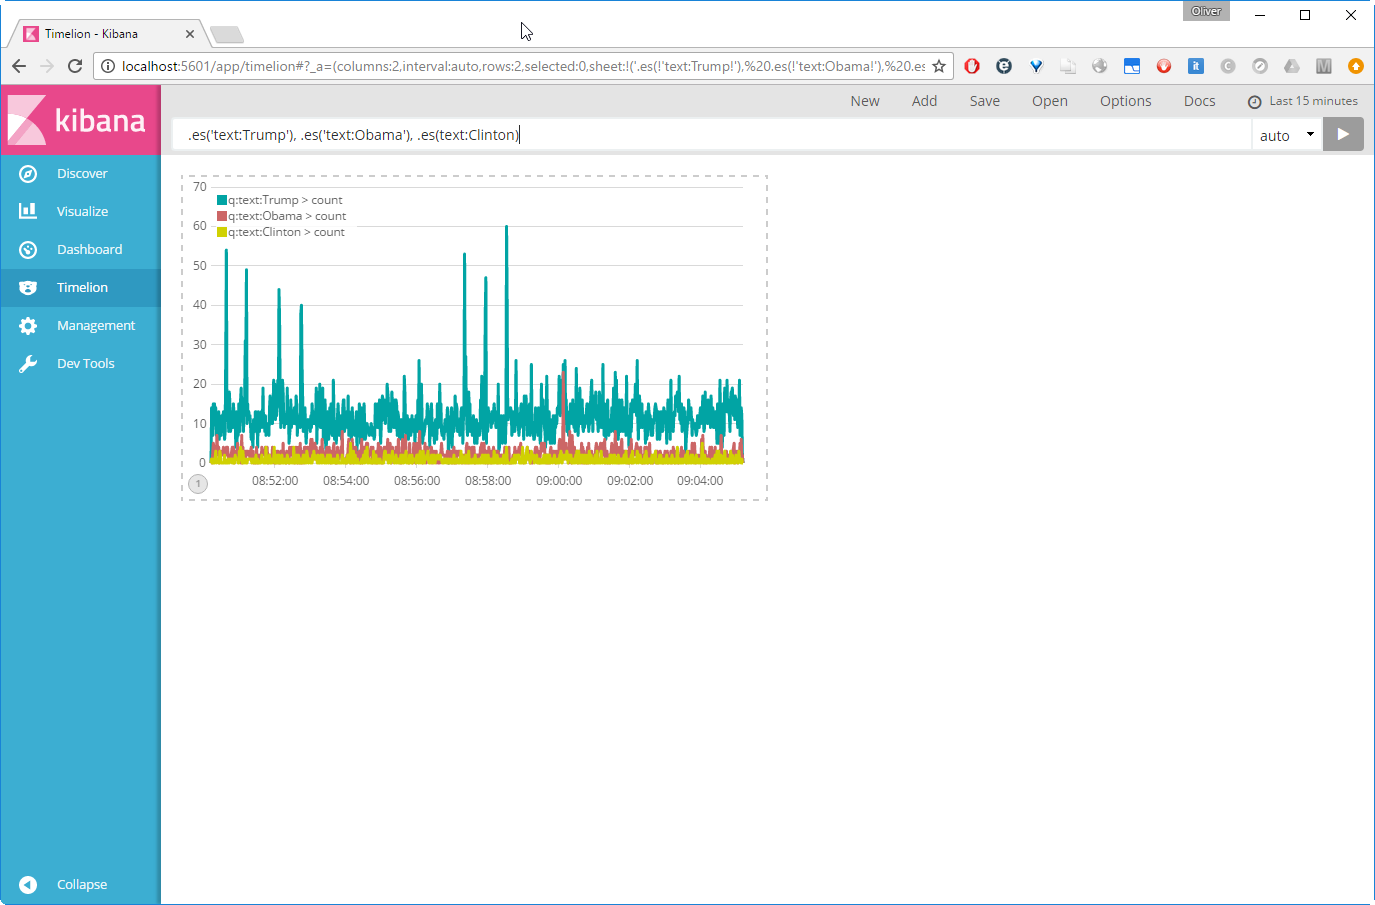
Let us save this as a Kibana dashboard panel with the name „Trump vs. Obama vs. Clinton Time Chart“, so we can use it in the next step.
Step 8: Define a Dashboard
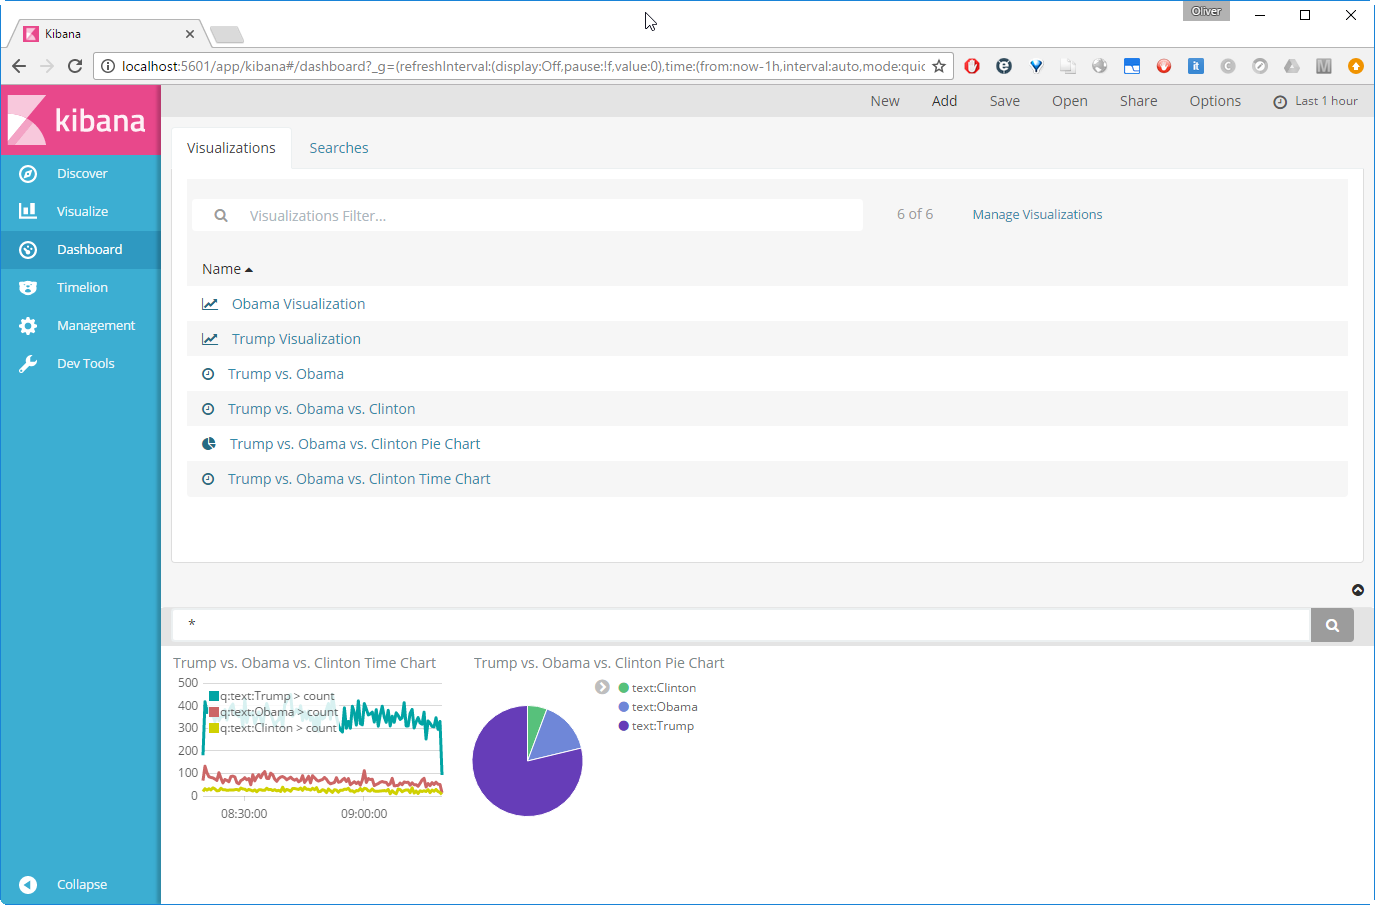
We now will create a dashboard. Click on ![]() on the left pane and click
on the left pane and click ![]() in the upper menu. Click on
in the upper menu. Click on ![]() and then on
and then on ![]() .
.
Clicking the white on black ![]() icon will give you more space.
icon will give you more space.
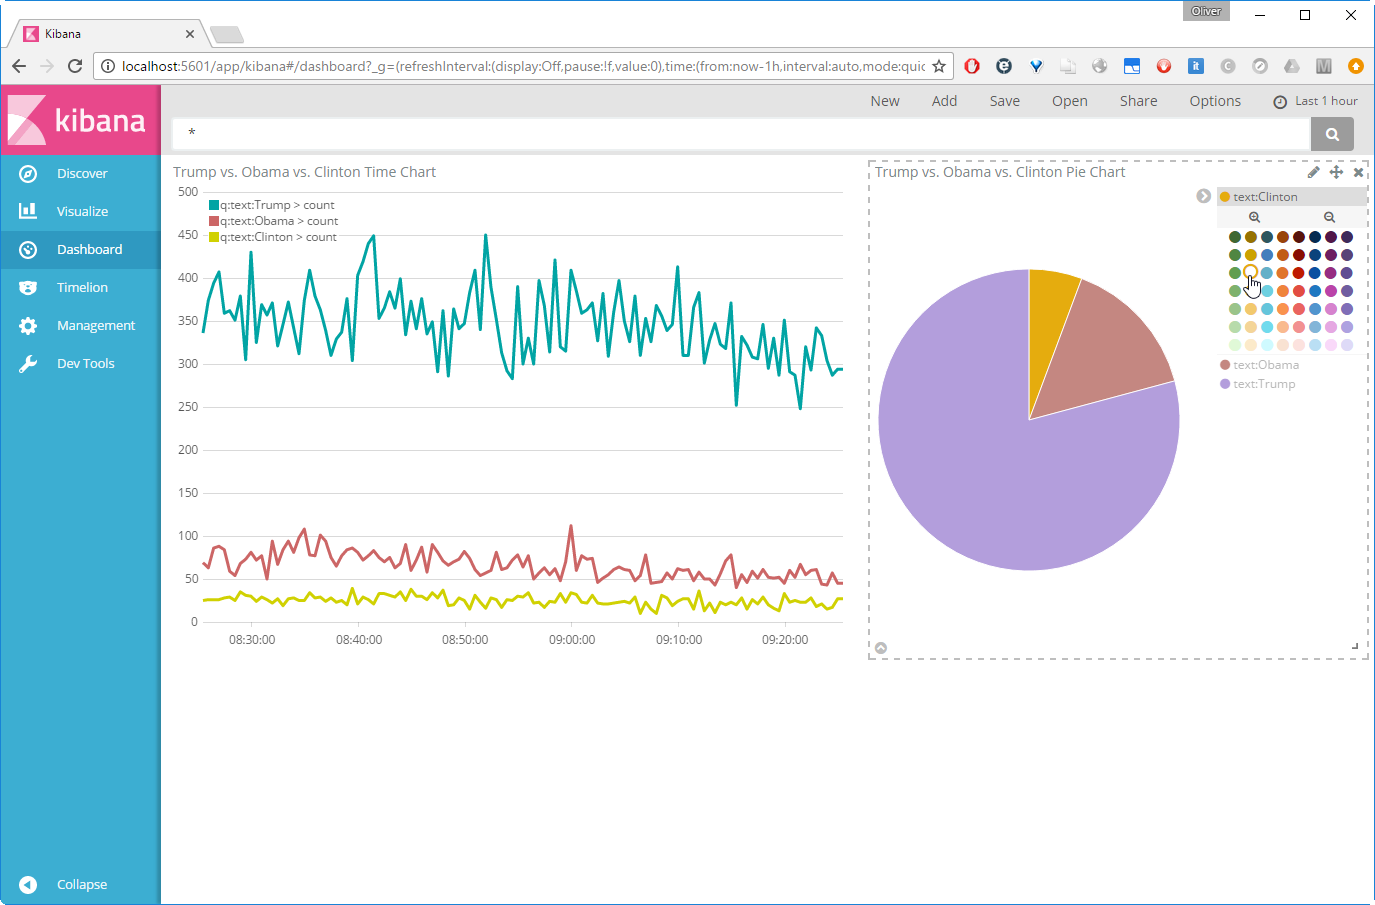
Resize the charts from the corner and move them, so they are aligned. We now see that the colors do not match yet:
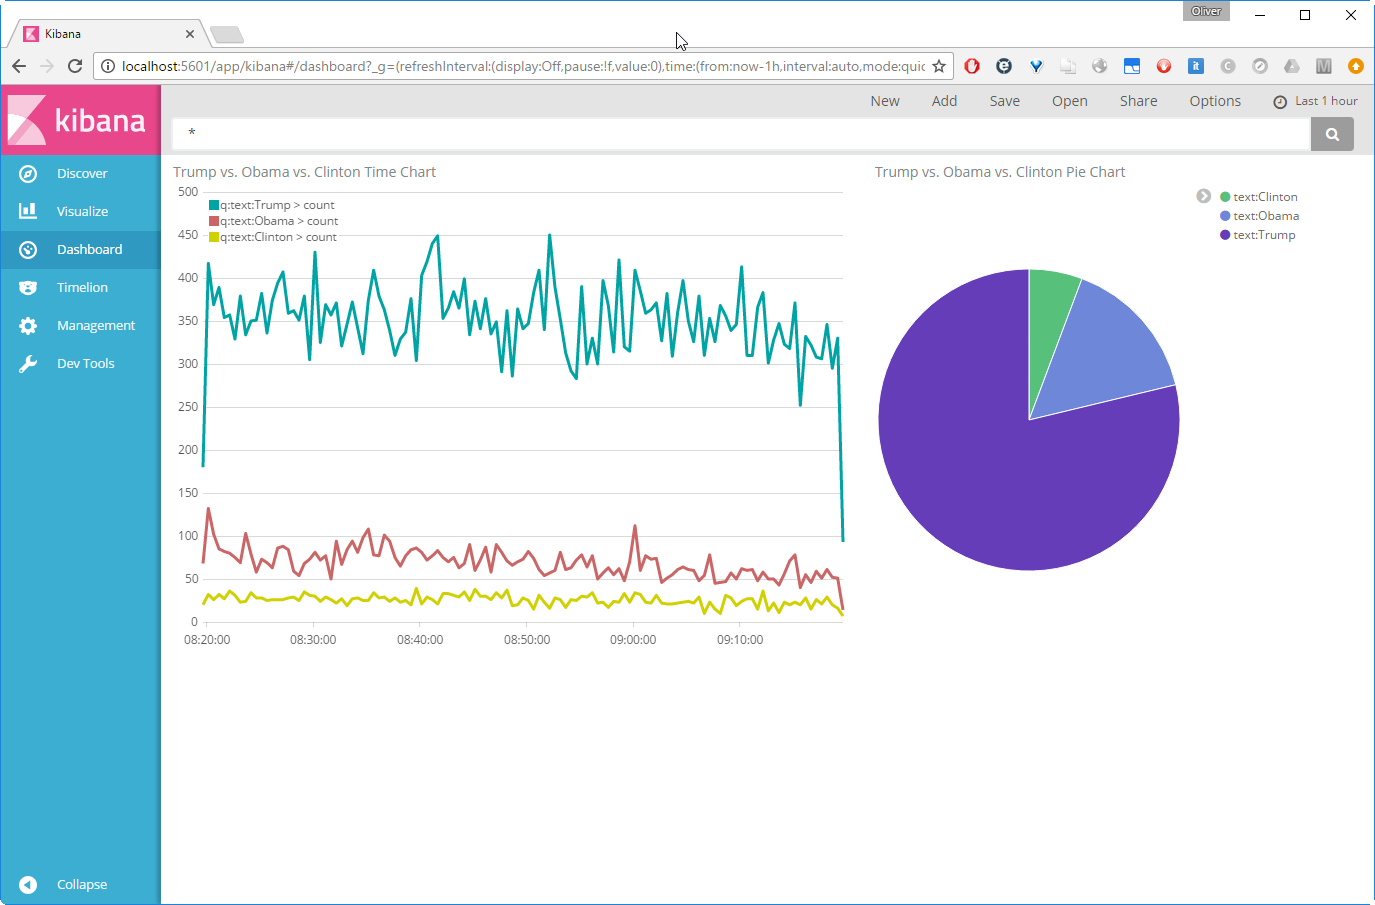
However, the colors of the Pie chart can easily be changed by clicking on the legends (it is not so easy on the Time chart, though).
Even if the colors are not 100% the same, we are coming closer:
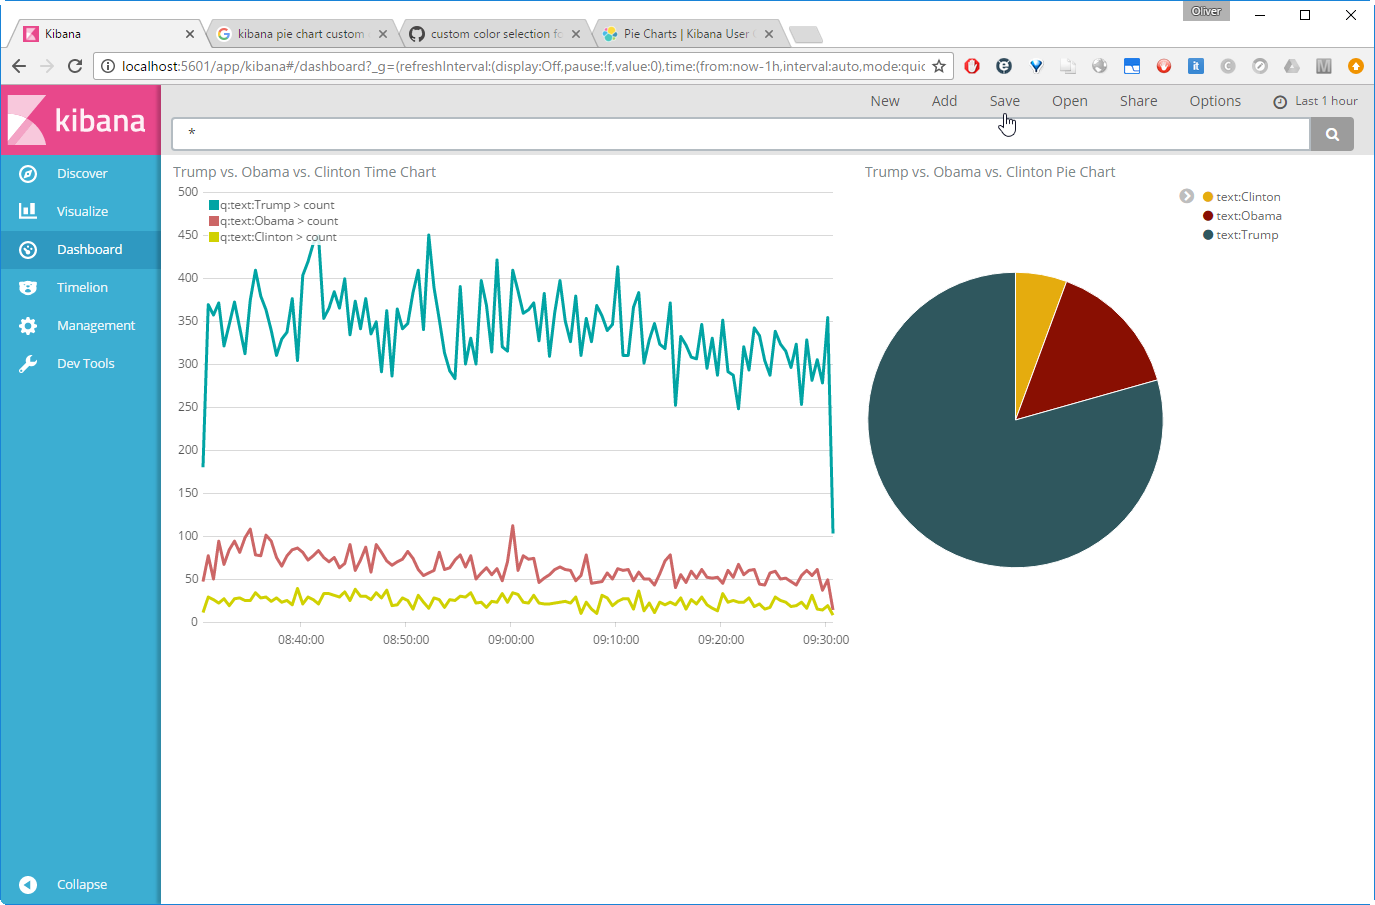
Let us ![]() this as „Popularity of US Politicians“ dashboard.
this as „Popularity of US Politicians“ dashboard.
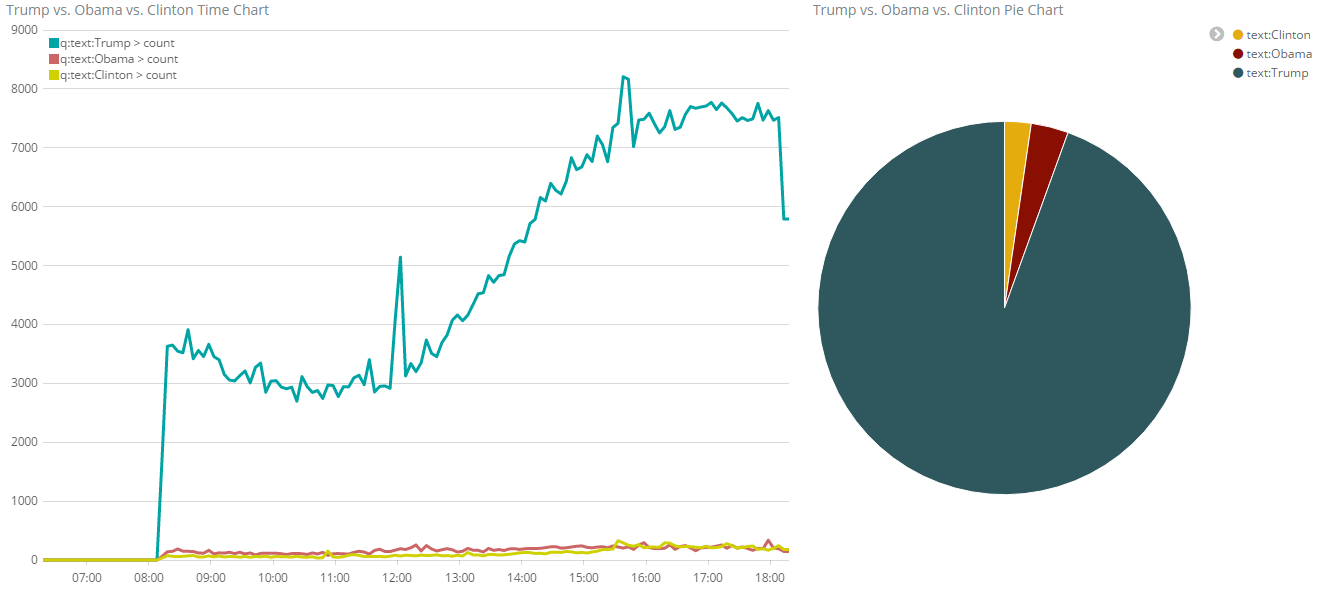
About 10 hours later, we can see the rise of tweets in the US, which is ~5 to 10 hours behind Germany’s time zone:
Summary
With this Hello World or Tutorial, we have shown
- how we can use Logstash to collect Twitter data,
- save it on Elasticsearch and
- use Kibana to visualize the Elasticsearch search queries.
We can see the rise and fall for the number of tweeds during a day and we also can see that the number of Trump tweets is outpacing those of Obama tweets and Clinton tweets by far.
DONE!
P.S.: the colors of the timelion graphs can also be changed easily by adding a .color(...) directive after the .es(...) . If we want to have Trump in red, Obama n blue and Clinton in green, we set:
.es('text:Trump').color('red'), .es('text:Obama').color('blue'), .es('text:Clinton').color('green')The resulting graph is:
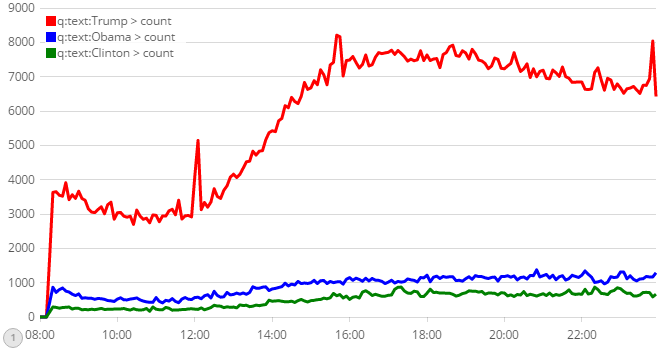
We also can use hex color codes like .color('#ff0000') instead of color names.
Appendix A: Error: Cannot allocate memory
This error has been seen by running Elasticsearch as a Docker container on a Docker host with only 250 MB RAM left (as seen with top).
(dockerhost) $
$ sudo docker run -it --rm elasticsearch --version
OpenJDK 64-Bit Server VM warning: INFO: os::commit_memory(0x000000008a660000, 1973026816, 0) failed; error='Cannot allocate memory' (errno=12)
#
# There is insufficient memory for the Java Runtime Environment to continue.
# Native memory allocation (mmap) failed to map 1973026816 bytes for committing reserved memory.
# An error report file with more information is saved as:
# /tmp/hs_err_pid1.log
Resolution:
A temporary resolution is to
- shut down the Vagrant Docker host via
vagrant halt
2. Open the Virtualbox console
3. Increase the memory by ~500 MB (right-click the VM on the left pane of the Virtualbox console -> change -> system -> increase memory)
4. Start Vagrant Docker host via
vagrant up
A permanent solution is to
- increase the value of vb.memory in the Vagrantfile line, e.g.
vb.memory = "1536"
by
vb.memory = "4096"
With that, next time a Virtualbox VM is created by Vagrant, the new value will be used. Also I have seen that the reboot has freed up quite some resources…
Appendix B: vm.max_map_count too low
The Elasticsearch application requires a minimum vm.max_map_count of 262144. See the official documentation for details. If this minimum requirement is not met, we see following log during startup of Elasticsearch:
$ sudo docker run -it --rm --name elasticsearch -p9200:9200 -p9300:9300 elasticsearch
[2016-11-18T13:29:35,124][INFO ][o.e.n.Node ] [] initializing ...
[2016-11-18T13:29:35,258][INFO ][o.e.e.NodeEnvironment ] [SfJmZdJ] using [1] data paths, mounts [[/usr/share/elasticsearch/data (/dev/dm-0)]], net usable_space [32.3gb], net total_space [38.2gb], spins? [possibly], types [ext4]
[2016-11-18T13:29:35,258][INFO ][o.e.e.NodeEnvironment ] [SfJmZdJ] heap size [1.9gb], compressed ordinary object pointers [true]
[2016-11-18T13:29:35,261][INFO ][o.e.n.Node ] [SfJmZdJ] node name [SfJmZdJ] derived from node ID; set [node.name] to override
[2016-11-18T13:29:35,267][INFO ][o.e.n.Node ] [SfJmZdJ] version[5.0.1], pid[1], build[080bb47/2016-11-11T22:08:49.812Z], OS[Linux/4.2.0-42-generic/amd64], JVM[Oracle Corporation/OpenJDK 64-Bit Server VM/1.8.0_111/25.111-b14]
[2016-11-18T13:29:37,449][INFO ][o.e.p.PluginsService ] [SfJmZdJ] loaded module [aggs-matrix-stats]
[2016-11-18T13:29:37,450][INFO ][o.e.p.PluginsService ] [SfJmZdJ] loaded module [ingest-common]
[2016-11-18T13:29:37,451][INFO ][o.e.p.PluginsService ] [SfJmZdJ] loaded module [lang-expression]
[2016-11-18T13:29:37,452][INFO ][o.e.p.PluginsService ] [SfJmZdJ] loaded module [lang-groovy]
[2016-11-18T13:29:37,452][INFO ][o.e.p.PluginsService ] [SfJmZdJ] loaded module [lang-mustache]
[2016-11-18T13:29:37,453][INFO ][o.e.p.PluginsService ] [SfJmZdJ] loaded module [lang-painless]
[2016-11-18T13:29:37,455][INFO ][o.e.p.PluginsService ] [SfJmZdJ] loaded module [percolator]
[2016-11-18T13:29:37,455][INFO ][o.e.p.PluginsService ] [SfJmZdJ] loaded module [reindex]
[2016-11-18T13:29:37,456][INFO ][o.e.p.PluginsService ] [SfJmZdJ] loaded module [transport-netty3]
[2016-11-18T13:29:37,456][INFO ][o.e.p.PluginsService ] [SfJmZdJ] loaded module [transport-netty4]
[2016-11-18T13:29:37,457][INFO ][o.e.p.PluginsService ] [SfJmZdJ] no plugins loaded
[2016-11-18T13:29:37,807][WARN ][o.e.d.s.g.GroovyScriptEngineService] [groovy] scripts are deprecated, use [painless] scripts instead
[2016-11-18T13:29:43,310][INFO ][o.e.n.Node ] [SfJmZdJ] initialized
[2016-11-18T13:29:43,310][INFO ][o.e.n.Node ] [SfJmZdJ] starting ...
[2016-11-18T13:29:43,716][INFO ][o.e.t.TransportService ] [SfJmZdJ] publish_address {172.17.0.3:9300}, bound_addresses {[::]:9300}
[2016-11-18T13:29:43,725][INFO ][o.e.b.BootstrapCheck ] [SfJmZdJ] bound or publishing to a non-loopback or non-link-local address, enforcing bootstrap checks
ERROR: bootstrap checks failed
max virtual memory areas vm.max_map_count [65530] is too low, increase to at least [262144]
[2016-11-18T13:29:43,741][INFO ][o.e.n.Node ] [SfJmZdJ] stopping ...
[2016-11-18T13:29:43,763][INFO ][o.e.n.Node ] [SfJmZdJ] stopped
[2016-11-18T13:29:43,764][INFO ][o.e.n.Node ] [SfJmZdJ] closing ...
[2016-11-18T13:29:43,791][INFO ][o.e.n.Node ] [SfJmZdJ] closed
Resolution:
Temporary solution:
(dockerhost) $ sudo sysctl -w vm.max_map_count=262144
and reboot the system.
Permanent solution on LINUX hosts:
Update the vm.max_map_count setting to 262144 or more in /etc/sysctl.conf. To verify after rebooting, run sysctl vm.max_map_count.
Permanent solution for future Vagrant-created LINUX hosts:
In case we use Vagrant to create Linux VMs, we also need to make sure the next VM is created with the correct vm.max_map_count setting. For that, we can run a startup.sh file like described here:
In the Vagrantfile we set:
config.vm.provision :file, :source => "elasticsearchpreparation.sh", :destination => "/tmp/elasticsearchpreparation.sh"
config.vm.provision :shell, :inline => "sudo sed -i 's/\r//g' /tmp/elasticsearchpreparation.sh && chmod +x /tmp/elasticsearchpreparation.sh && /tmp/elasticsearchpreparation.sh", :privileged => true
with the file elasticsearchpreparation.sh:
#!/usr/bin/env bash
# file: elasticsearchpreparation.sh
sudo sysctl -w vm.max_map_count=262144
ulimit -n 65536
The sed and chmod commands make sense on Windows hosts in order to make sure the file has UNIX format and and has the required rights. Also here, make sure to run sysctl vm.max_map_count in order to check, that the configuration is active (might require a reboot).
Appendix C: Typical Kibana Startup Logs
Successful Log
Here we see a successful startup log:
root@f13588d10379:/# /docker-entrypoint.sh kibana
[WARN  tini (5)] Tini is not running as PID 1 and isn't registered as a child subreaper.
        Zombie processes will not be re-parented to Tini, so zombie reaping won't work.
        To fix the problem, use -s or set the environment variable TINI_SUBREAPER to register Tini as a child subreaper, or run Tini as PID 1.
  log   [16:28:02.791] [info][status][plugin:kibana@5.0.1] Status changed from uninitialized to green - Ready
  log   [16:28:02.842] [info][status][plugin:elasticsearch@5.0.1] Status changed from uninitialized to yellow - Waiting for Elasticsearch
  log   [16:28:02.867] [info][status][plugin:console@5.0.1] Status changed from uninitialized to green - Ready
  log   [16:28:03.074] [info][status][plugin:timelion@5.0.1] Status changed from uninitialized to green - Ready
  log   [16:28:03.080] [info][listening] Server running at http://0.0.0.0:5601
  log   [16:28:03.085] [info][status][ui settings] Status changed from uninitialized to yellow - Elasticsearch plugin is yellow
  log   [16:28:08.118] [info][status][plugin:elasticsearch@5.0.1] Status changed from yellow to yellow - No existing Kibana index found
  log   [16:28:08.269] [info][status][plugin:elasticsearch@5.0.1] Status changed from yellow to green - Kibana index ready
  log   [16:28:08.270] [info][status][ui settings] Status changed from yellow to green - Ready
At this point the system has connected successfully to Elasticsearch, as can be seen in the last three log lines above.
Logs if Elasticsearch is not reachable
If Kibana cannot connect to Elasticsearch on the IP layer (e.g. because the Docker container link is missing) the last four lines of the successful log are replaced by:
  log   [16:45:51.597] [info][status][ui settings] Status changed from uninitialized to yellow - Elasticsearch plugin is yellow
  log   [16:45:54.407] [error][status][plugin:elasticsearch@5.0.1] Status changed from yellow to red - Request Timeout after 3000ms
  log   [16:45:54.410] [error][status][ui settings] Status changed from yellow to red - Elasticsearch plugin is red
...
To correct the issue, make sure that the Elasticsearch server (or container) is reachable from the Kibana server (or container).
Logs if Elasticsearch is reachable but not started (TCP RST)
If it can reach the Elasticsearch server, but the Elasticsearch process has not been started, the error messages appear even earlier in the log:
(kibanacontainer)# /docker-entrypoint.sh kibana
[WARN  tini (8)] Tini is not running as PID 1 and isn't registered as a child subreaper.
        Zombie processes will not be re-parented to Tini, so zombie reaping won't work.
        To fix the problem, use -s or set the environment variable TINI_SUBREAPER to register Tini as a child subreaper, or run Tini as PID 1.
  log   [17:06:57.714] [info][status][plugin:kibana@5.0.1] Status changed from uninitialized to green - Ready
  log   [17:06:57.763] [info][status][plugin:elasticsearch@5.0.1] Status changed from uninitialized to yellow - Waiting for Elasticsearch
  log   [17:06:57.780] [error][elasticsearch] Request error, retrying
HEAD http://elasticsearch:9200/ => connect ECONNREFUSED 172.17.0.3:9200
  log   [17:06:57.794] [warning][elasticsearch] Unable to revive connection: http://elasticsearch:9200/
  log   [17:06:57.795] [warning][elasticsearch] No living connections
  log   [17:06:57.798] [error][status][plugin:elasticsearch@5.0.1] Status changed from yellow to red - Unable to connect to Elasticsearch at http://elasticsearch:9200.
  log   [17:06:57.800] [info][status][plugin:console@5.0.1] Status changed from uninitialized to green - Ready
  log   [17:06:57.981] [info][status][plugin:timelion@5.0.1] Status changed from uninitialized to green - Ready
  log   [17:06:57.989] [info][listening] Server running at http://0.0.0.0:5601
  log   [17:06:57.992] [error][status][ui settings] Status changed from uninitialized to red - Elasticsearch plugin is red
  log   [17:07:00.309] [warning][elasticsearch] Unable to revive connection: http://elasticsearch:9200/
  log   [17:07:00.314] [warning][elasticsearch] No living connections
To correct the issue, make sure that the Elasticsearch server (or container) is reachable from the Kibana server (or container), that the Elasticsearch process is started and the port is reachable from outside. This may involve to map TCP ports from inside networks to outside networks. In the example of this blog post, the container port is mapped with the docker run -p9200:9200 switch from the container to the Docker host, and then the Docker host port is mapped via Virtualbox forwarding from the Docker host VM to the local machine.
Summary
In this blog post we have performed following tasks:
- attach Logstash to the Twitter API for retrieval of all tweeds with the Keywords „Obama“ or „Trump“ or „Clinton“
- feed Logstash’s data into Elasticsearch
- attach Kibana to Elasticsearch and visualize the statistics on how often the text pattern „Obama“, „Trump“ and „Clinton“ is found in the recorded tweets. The total number is shown in a Pie Chart and the date/time histogram is shown in a Line Chart with more than one search term in a single chart. The latter can be done by usage of the Timelion plugin.
In order to avoid any compatibility issues with the java version on the host, we have run Kibana, Elasticsearch and Logstash in Docker containers. In order to better see what happens under the hood, we have chosen Docker containers in interactive terminal mode. In the course of the Elasticsearch „Hello World“ in the last blog post, we had hit two Memory resource issues: too low memory and too low number of mapped memory areas. Those issues and their workarounds/solutions are described in Appendix A and B here and in the last blog post.
References
- The Elasticsearch Examples can be found on this GIT repository.
- Logstash „Hello World“ blog post with Docker Containers.
- Elasticsearch „Hello World“ blog post with Docker Containers.
Appendix: Standard Visualization with x-Axis Splitting (as an Alternative of Timelion)
The visualization can also be done without timelion as follows (Example showing percent CPU of several hosts):
Fields:
- timestamp
How to create visualization:
- Delete Index, so all fields and their types are discovered anew
- ? Visualize ? + (Add)
- ? Y-Axis
- ? Aggregation: Max
- ? Field: cpu_percent
- ? X-Axis
- ? Aggregation: Date Histogram
- ? Field: timestamp
- ? Add sub-buckets
- ? Split Series
- ? Sub Aggregation: Terms
- ? Field: host.keyword
- ? Order By: metric: Max cpu_percent
- ? Save
- ? Enter Name
- ? Save
![]()
![]()
![]()