
Today, we will learn how to automatically create performance trend analysis reports like the following using Jenkins and JMeter:

First, we will use Apache JMeter’s graphical user interface on the developer’s PC to create a test plan, before we integrate JMeter into Maven for the creation of performance reports on the command line. Finally, we will use Jenkins to aggregate the results into historic reports like the one we have shown above.
This Jenkins blog post series is divided into following parts:
- Part 1: Installation and Configuration of Jenkins, loading Plugins
- Part 2: Creating our first Jenkins job: GitHub download and Software build
- Part 3: Periodic and automatically triggered Builds
- Part 4.1: running automated tests: Functional Tests via Java JUnit
- Part 4.2: running automated tests: Code Quality Test via Checkstyle
- Part 4.3: running automated tests: Performance Tests with JMeter (this blog)
Why do we need Performance Reporting during the Development Process?
In a waterfall process, performance was measured as a one-time effort before the release of the software. However, if you find out that the software performance is poor that late in the process, it is often time-consuming and costly to improve the situation.
If you integrate performance testing into your continuous integration pipeline instead, the developers are always kept informed about the performance of their software. Any time there is a change that affects the software’s response time, the developers get feedback and they have the chance to improve the situation exactly at the code part that has caused the performance issue.
Automated Performance Testing with Jenkins
In this blog post, we will show how to configure Jenkins for automated performance testing using JMeter. The performance tests will be accomplished after test and build of the project was accomplished:
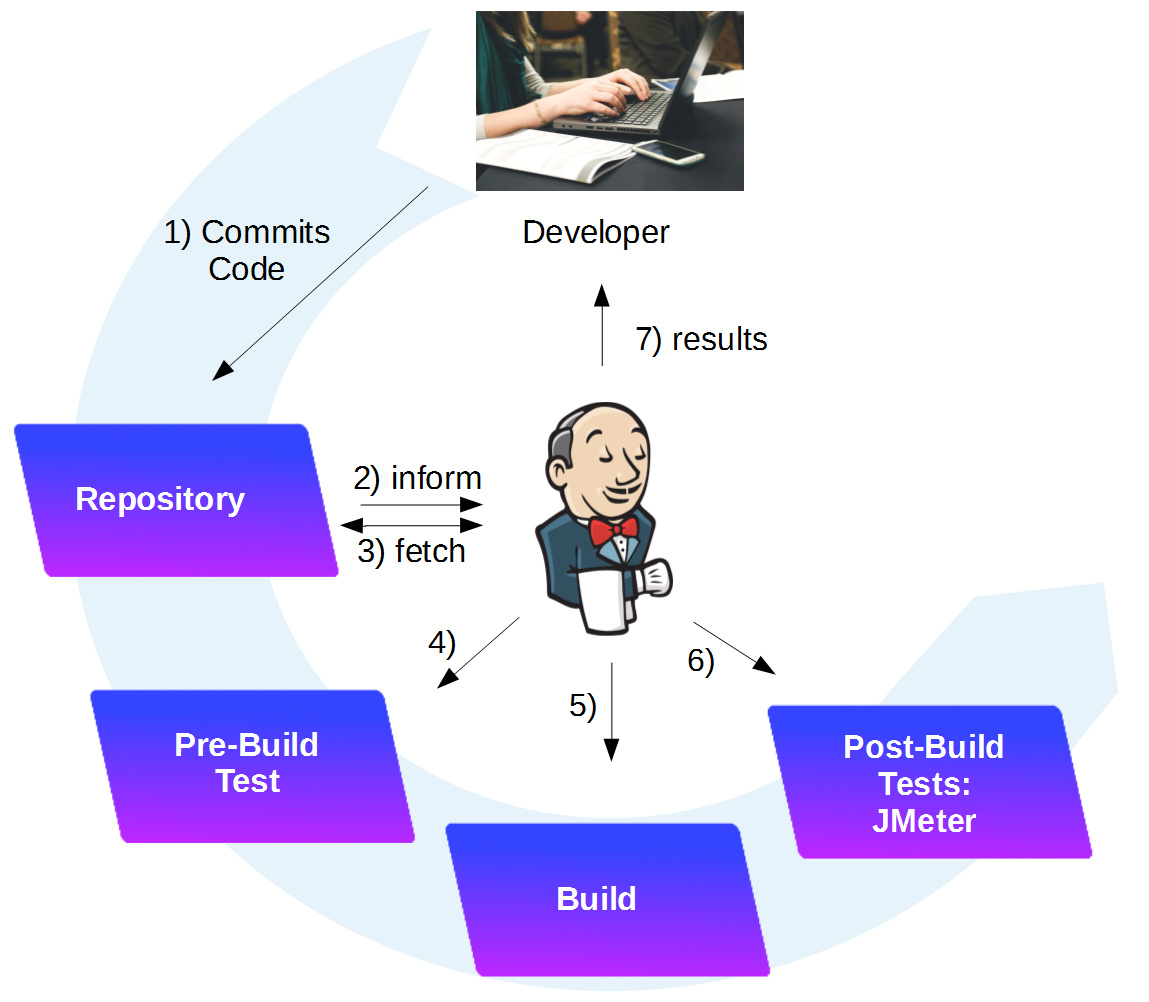
After this tutorial has been followed, we will have learned how to use JMeter locally on the developer’s PC and to integrate it into Maven and Jenkins for performance trend reporting. The build flow will be comprised of following steps:
- The developer commits code to the remote repository
- Jenkins detects the code change and will fetch the changed code
- Jenkins will perform Unit tests and Checkstyle tests (in our case) and build the executable JAR. Those are the steps I have described in my previous blog posts (see above).
- Now, we will learn how Jenkins can run the JAR in the background in order to open the local server port
- While the JAR file is running, we will perform JMeter performance tests. This will create JMeter report files (.jtl)
- At the end, the running JAR file is stopped automatically
- As a post-build process, Jenkins will collect and aggregate the information found in the JMeter report files
Tools and Versions used
- Vagrant 1.8.6
- Virtualbox 5.0.20
- Docker 1.12.1
- Jenkins 2.32.1
- JMeter 2.9
- Maven JMeter Plugin 2.1.0
Prerequisites:
Step 1: Download and Install Apache JMeter v2.9 locally
A test plan can be created by downloading Apache JMeter version 2.9 from here (see note below!), starting the JMeter GUI and defining the test plan. For a quick start, I will provide you with an example test plan below you can adapt to your needs.
(!) Note: In order to avoid any incompatibilities with the Maven JMeter plugin 2.1.0 we will use later, we need to use Apache JMeter version 2.9 instead of the latest JMeter version (currently 3.1).
Step 2: Copy Test Plan Example
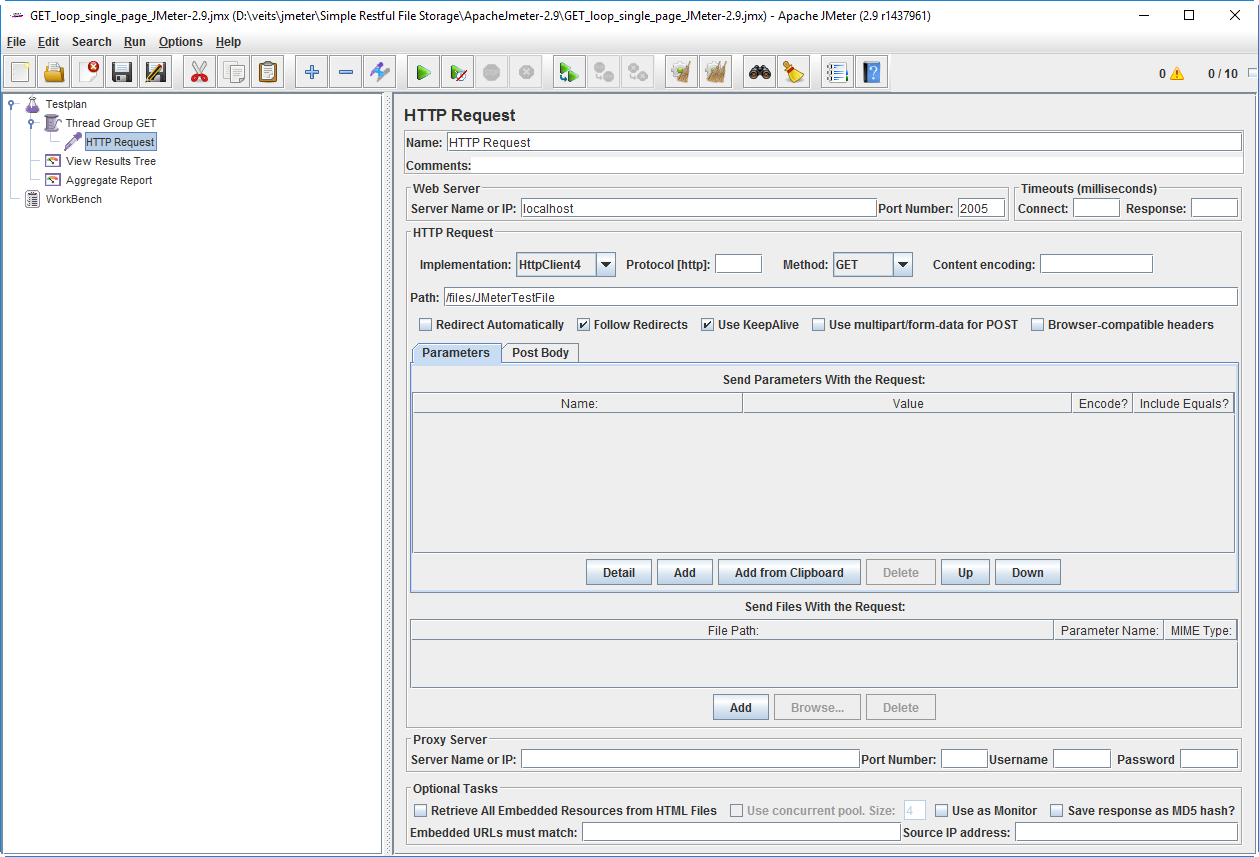
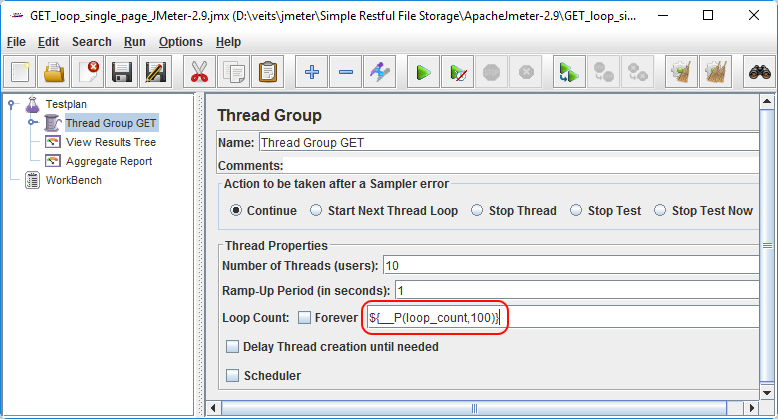
As a head start, we use the JMeter configuration file shown below. It is a simplistic test plan that is reading a single Web page in 10 threads in a loop 100 times each:
http://localhost:2005/files/JMeterTestFile
The corresponding values of the host, port, path, number of threads and loop count can be seen below in red. Please adapt them as required:
<?xml version="1.0" encoding="UTF-8"?>
<jmeterTestPlan version="1.2" properties="2.4" jmeter="2.9 r1437961">
  <hashTree>
    <TestPlan guiclass="TestPlanGui" testclass="TestPlan" testname="Testplan" enabled="true">
      <stringProp name="TestPlan.comments"></stringProp>
      <boolProp name="TestPlan.functional_mode">false</boolProp>
      <boolProp name="TestPlan.serialize_threadgroups">false</boolProp>
      <elementProp name="TestPlan.user_defined_variables" elementType="Arguments" guiclass="ArgumentsPanel" testclass="Arguments" testname="Benutzer definierte Variablen" enabled="true">
        <collectionProp name="Arguments.arguments"/>
      </elementProp>
      <stringProp name="TestPlan.user_define_classpath"></stringProp>
    </TestPlan>
    <hashTree>
      <ThreadGroup guiclass="ThreadGroupGui" testclass="ThreadGroup" testname="Thread Group GET" enabled="true">
        <stringProp name="ThreadGroup.on_sample_error">continue</stringProp>
        <elementProp name="ThreadGroup.main_controller" elementType="LoopController" guiclass="LoopControlPanel" testclass="LoopController" testname="Loop Controller" enabled="true">
          <boolProp name="LoopController.continue_forever">false</boolProp>
          <stringProp name="LoopController.loops">100</stringProp>
        </elementProp>
        <stringProp name="ThreadGroup.num_threads">10</stringProp>
        <stringProp name="ThreadGroup.ramp_time">1</stringProp>
        <longProp name="ThreadGroup.start_time">1486821935000</longProp>
        <longProp name="ThreadGroup.end_time">1486821935000</longProp>
        <boolProp name="ThreadGroup.scheduler">false</boolProp>
        <stringProp name="ThreadGroup.duration"></stringProp>
        <stringProp name="ThreadGroup.delay"></stringProp>
      </ThreadGroup>
      <hashTree>
        <HTTPSamplerProxy guiclass="HttpTestSampleGui" testclass="HTTPSamplerProxy" testname="HTTP Request" enabled="true">
          <elementProp name="HTTPsampler.Arguments" elementType="Arguments" guiclass="HTTPArgumentsPanel" testclass="Arguments" testname="User Defined Variables" enabled="true">
            <collectionProp name="Arguments.arguments"/>
          </elementProp>
          <stringProp name="HTTPSampler.domain">localhost</stringProp>
          <stringProp name="HTTPSampler.port">2005</stringProp>
          <stringProp name="HTTPSampler.connect_timeout"></stringProp>
          <stringProp name="HTTPSampler.response_timeout"></stringProp>
          <stringProp name="HTTPSampler.protocol"></stringProp>
          <stringProp name="HTTPSampler.contentEncoding"></stringProp>
          <stringProp name="HTTPSampler.path">/files/JMeterTestFile</stringProp>
          <stringProp name="HTTPSampler.method">GET</stringProp>
          <boolProp name="HTTPSampler.follow_redirects">true</boolProp>
          <boolProp name="HTTPSampler.auto_redirects">false</boolProp>
          <boolProp name="HTTPSampler.use_keepalive">true</boolProp>
          <boolProp name="HTTPSampler.DO_MULTIPART_POST">false</boolProp>
          <stringProp name="HTTPSampler.implementation">HttpClient4</stringProp>
          <boolProp name="HTTPSampler.monitor">false</boolProp>
          <stringProp name="HTTPSampler.embedded_url_re"></stringProp>
        </HTTPSamplerProxy>
        <hashTree/>
      </hashTree>
      <ResultCollector guiclass="ViewResultsFullVisualizer" testclass="ResultCollector" testname="View Results Tree" enabled="true">
        <boolProp name="ResultCollector.error_logging">false</boolProp>
        <objProp>
          <name>saveConfig</name>
          <value class="SampleSaveConfiguration">
            <time>true</time>
            <latency>true</latency>
            <timestamp>true</timestamp>
            <success>true</success>
            <label>true</label>
            <code>true</code>
            <message>true</message>
            <threadName>true</threadName>
            <dataType>true</dataType>
            <encoding>false</encoding>
            <assertions>true</assertions>
            <subresults>true</subresults>
            <responseData>false</responseData>
            <samplerData>false</samplerData>
            <xml>false</xml>
            <fieldNames>false</fieldNames>
            <responseHeaders>false</responseHeaders>
            <requestHeaders>false</requestHeaders>
            <responseDataOnError>false</responseDataOnError>
            <saveAssertionResultsFailureMessage>false</saveAssertionResultsFailureMessage>
            <assertionsResultsToSave>0</assertionsResultsToSave>
            <bytes>true</bytes>
          </value>
        </objProp>
        <stringProp name="filename"></stringProp>
      </ResultCollector>
      <hashTree/>
      <ResultCollector guiclass="StatVisualizer" testclass="ResultCollector" testname="Aggregate Report" enabled="true">
        <boolProp name="ResultCollector.error_logging">false</boolProp>
        <objProp>
          <name>saveConfig</name>
          <value class="SampleSaveConfiguration">
            <time>true</time>
            <latency>true</latency>
            <timestamp>true</timestamp>
            <success>true</success>
            <label>true</label>
            <code>true</code>
            <message>true</message>
            <threadName>true</threadName>
            <dataType>true</dataType>
            <encoding>false</encoding>
            <assertions>true</assertions>
            <subresults>true</subresults>
            <responseData>false</responseData>
            <samplerData>false</samplerData>
            <xml>false</xml>
            <fieldNames>false</fieldNames>
            <responseHeaders>false</responseHeaders>
            <requestHeaders>false</requestHeaders>
            <responseDataOnError>false</responseDataOnError>
            <saveAssertionResultsFailureMessage>false</saveAssertionResultsFailureMessage>
            <assertionsResultsToSave>0</assertionsResultsToSave>
            <bytes>true</bytes>
          </value>
        </objProp>
        <stringProp name="filename"></stringProp>
      </ResultCollector>
      <hashTree/>
    </hashTree>
  </hashTree>
</jmeterTestPlan>
Now save this text as a .jmx file on the src/test/jmeter folder on your project’s home, e.g.:
$ ls src/test/jmeter/
GET_loop_single_page_JMeter-2.9.jmx
Step 3: Test and adapt the JMeter Configuration using the graphical Interface
Open the JMX file in the graphical Interface of Apache JMeter 2.9. For that, you can open it via the ![]() icon.
icon.
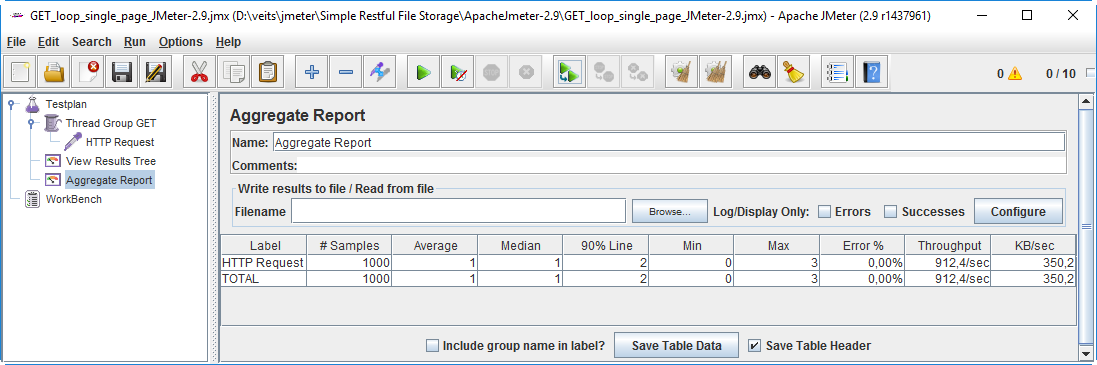
Start the test by pressing ![]() on the JMeter GUI. On the Aggregate Report, you can see the performance statistics.
on the JMeter GUI. On the Aggregate Report, you can see the performance statistics.
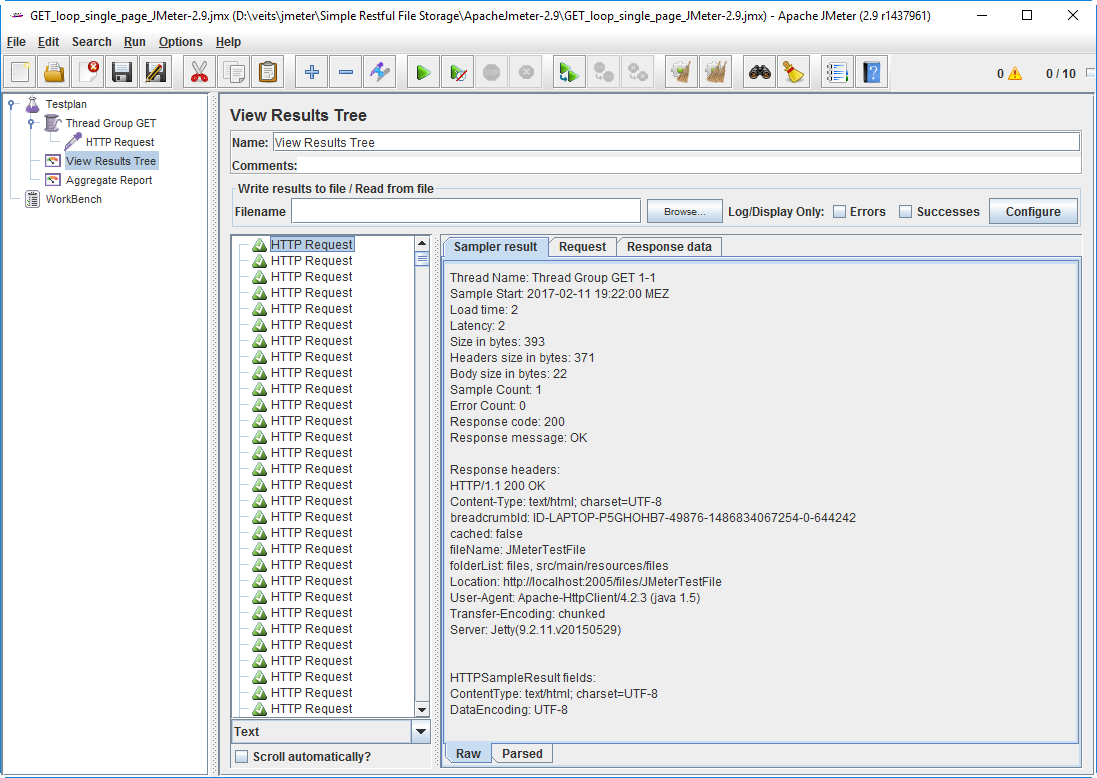
In case you need to troubleshoot reported errors, the „Results Tree“ comes in handy:
Now you can go to step 4, or you also can run the Software on the command line, if you wish:
jmeter -n -t PerformanceTest.jmx
Note that you can also define the variables at run time: see this Blog post describing how runtime variables can be used on the command line interface: e.g.
${__P(<variable name>,<default value>)}
jmeter -n -t PerformanceTest.jmx -J<variable name>=<value>
As an example, just enter
${__P(loop_count,100)}instead of just „100“ on the loop field.
Then you can start the command with
jmeter -n -t PerformanceTest.jmx -Jloop_count=1000
for increasing the loop from 100 to 1000.
Step 4: Install the Maven JMeter Plugin
From this German HowTo blog post, we copy the following plugin configuration into the pom.xml file of the Maven project (the project I am using is both, a Maven project as well as a Gradle project):
<plugin>
  <groupId>com.lazerycode.jmeter</groupId>
  <artifactId>jmeter-maven-plugin</artifactId>
  <version>2.1.0</version>
  <configuration>
    <!--
       Die Ergebnisse werden normalerweise in einer Datei
       /target/jmeter/results/<TestName>-<TimeStamp>.jtl abgelegt.
       Für die Weiterverarbeitung ist der Timestamp nur hinderlich.
    -->
    <testResultsTimestamp>false</testResultsTimestamp>

    <!--
       Für die Fehlersuche bewährt es sich anfangs das LogLevel hochzuschrauben.
       Die JMeter-Logs werden in die Datei jmeter.log geschrieben.
    -->
    <overrideRootLogLevel>DEBUG</overrideRootLogLevel>

    <!--
       Konsolen-Ausgaben des JMeter-Prozesses werden standardmäßig unterdrückt (warum auch
       immer). Es wird aber explizit der Listener "Create Summary Results" verwendet, damit
       auf der Konsole der aktuelle Testfortschritt mitverfolgt werden kann.
    -->
    <suppressJMeterOutput>false</suppressJMeterOutput>

    <!--
       Wenn Tests fehlschlagen (z.B. HTTP-Requests in einen Timeout laufen), wird normalerweise
       auch das entsprechende Maven-Goal als fehlerhaft markiert (und nachfolgende Schritte nicht
       mehr ausgeführt). Im Beispiel sollen aber trotz Fehler Graphen erzeugt werden.
    -->
    <ignoreResultFailures>true</ignoreResultFailures>
  </configuration>
  <dependencies>
    <dependency>
      <groupId>kg.apc</groupId>
      <artifactId>jmeter-plugins</artifactId>
      <version>1.0.0</version>
      <exclusions>
         <!--
            Leider sind einige Abhängigkeiten nicht in mvncentral zu finden,
            deshalb müssen sie hier explizit ausgeschlossen werden.
            Für eine vollständge Liste, siehe https://github.com/mlex/jmeter-maven-example/
        -->
        <exclusion>
            <groupId>kg.apc</groupId>
            <artifactId>perfmon</artifactId>
        </exclusion>
        <!-- ... -->

        <!--
            Aufgrund eines Bugs im jmeter-maven-plugin (siehe
            https://github.com/Ronnie76er/jmeter-maven-plugin/issues/77) müssen
            JMeter-Abhängigkeiten auch ausgeschlossen werden.
        -->
        <exclusion>
            <groupId>org.apache.jmeter</groupId>
            <artifactId>jorphan</artifactId>
        </exclusion>
        <!-- ... -->
      </exclusions>
    </dependency>
  </dependencies>
</plugin>
Now let us run the server software and the Maven JMeter plugin.
Step 5: Run the Server Software
If you are developing your server software in Eclipse, start the server now. As an alternative, if you have an executable JAR file available, run it via a java -jar command.
Step 6: Run the Maven JMeter Plugin
Now we are ready to run the Maven JMeter plugin manually like follows (the clean goal is not mandatory, but helps to avoid confusion with older JMX files, if this is not the first test run):
$ mvn clean jmeter:jmeter
[INFO] Scanning for projects...
Downloading: https://repository.apache.org/content/repositories/releases/com/lazerycode/jmeter/jmeter-maven-plugin/2.1.0/jmeter-maven-plugin-2.1.0.pom
Downloading: http://repo.fusesource.com/nexus/content/repositories/releases/com/lazerycode/jmeter/jmeter-maven-plugin/2.1.0/jmeter-maven-plugin-2.1.0.pom
Downloading: http://repo.fusesource.com/nexus/content/groups/ea/com/lazerycode/jmeter/jmeter-maven-plugin/2.1.0/jmeter-maven-plugin-2.1.0.pom
Downloading: https://repo.maven.apache.org/maven2/com/lazerycode/jmeter/jmeter-maven-plugin/2.1.0/jmeter-maven-plugin-2.1.0.pom
Downloaded: https://repo.maven.apache.org/maven2/com/lazerycode/jmeter/jmeter-maven-plugin/2.1.0/jmeter-maven-plugin-2.1.0.pom (14 KB at 29.0 KB/sec)
Downloading: https://repository.apache.org/content/repositories/releases/com/lazerycode/jmeter/jmeter-maven-plugin/2.1.0/jmeter-maven-plugin-2.1.0.jar
Downloading: http://repo.fusesource.com/nexus/content/repositories/releases/com/lazerycode/jmeter/jmeter-maven-plugin/2.1.0/jmeter-maven-plugin-2.1.0.jar
Downloading: http://repo.fusesource.com/nexus/content/groups/ea/com/lazerycode/jmeter/jmeter-maven-plugin/2.1.0/jmeter-maven-plugin-2.1.0.jar
Downloading: https://repo.maven.apache.org/maven2/com/lazerycode/jmeter/jmeter-maven-plugin/2.1.0/jmeter-maven-plugin-2.1.0.jar
Downloaded: https://repo.maven.apache.org/maven2/com/lazerycode/jmeter/jmeter-maven-plugin/2.1.0/jmeter-maven-plugin-2.1.0.jar (42 KB at 187.4 KB/sec)
[INFO]
[INFO] ------------------------------------------------------------------------
[INFO] Building Velocity Temple 0.0.1-SNAPSHOT
[INFO] ------------------------------------------------------------------------
[INFO]
[INFO] --- jmeter-maven-plugin:2.1.0:jmeter (default-cli) @ camel-spring4 ---
Downloading: https://repository.apache.org/content/repositories/releases/kg/apc/jmeter-plugins/1.0.0/jmeter-plugins-1.0.0.pom
Downloading: http://repo.fusesource.com/nexus/content/repositories/releases/kg/apc/jmeter-plugins/1.0.0/jmeter-plugins-1.0.0.pom
Downloading: http://repo.fusesource.com/nexus/content/groups/ea/kg/apc/jmeter-plugins/1.0.0/jmeter-plugins-1.0.0.pom
Downloading: https://repo.maven.apache.org/maven2/kg/apc/jmeter-plugins/1.0.0/jmeter-plugins-1.0.0.pom
...
Downloading: https://repository.cloudera.com/content/repositories/snapshots/org/apache/thrift/thrift/0.2.0/thrift-0.2.0.jar
Downloading: https://repository.cloudera.com/content/groups/cloudera-repos/org/apache/thrift/thrift/0.2.0/thrift-0.2.0.jar
Downloading: http://people.apache.org/~rawson/repo/org/apache/thrift/thrift/0.2.0/thrift-0.2.0.jar
Downloaded: http://people.apache.org/~rawson/repo/org/apache/thrift/thrift/0.2.0/thrift-0.2.0.jar (184 KB at 610.4 KB/sec)
[INFO]
[INFO] -------------------------------------------------------
[INFO] P E R F O R M A N C E T E S T S
[INFO] -------------------------------------------------------
[INFO] Invalid value detected for <postTestPauseInSeconds>. Setting pause to 0...
[INFO]
[INFO]
[INFO] Executing test: GET_loop_single_page_JMeter-2.9.jmx
[INFO] Writing log file to: C:\Users\olive\git\simple-restful-file-storage\target\jmeter\logs\GET_loop_single_page_JMeter-2.9.jmx.log
[INFO] Creating summariser <summary>
[INFO] Created the tree successfully using C:\Users\olive\git\simple-restful-file-storage\target\jmeter\testFiles\GET_loop_single_page_JMeter-2.9.jmx
[INFO] Starting the test @ Sun Feb 12 23:53:59 CET 2017 (1486940039929)
[INFO] Waiting for possible Shutdown/StopTestNow/Heapdump message on port 4445
[INFO] summary + 1 in 00:00:00 = 6,0/s Avg: 34 Min: 34 Max: 34 Err: 0 (0,00%) Active: 2 Started: 2 Finished: 0
[INFO] summary + 999 in 00:00:01 = 994,0/s Avg: 3 Min: 1 Max: 79 Err: 0 (0,00%) Active: 0 Started: 10 Finished: 10
[INFO] summary = 1000 in 00:00:01 = 853,2/s Avg: 3 Min: 1 Max: 79 Err: 0 (0,00%)
[INFO] Tidying up ... @ Sun Feb 12 23:54:01 CET 2017 (1486940041154)
[INFO] ... end of run
[INFO] Completed Test: GET_loop_single_page_JMeter-2.9.jmx
[INFO] ------------------------------------------------------------------------
[INFO] BUILD SUCCESS
[INFO] ------------------------------------------------------------------------
[INFO] Total time: 7.666 s
[INFO] Finished at: 2017-02-12T23:54:01+01:00
[INFO] Final Memory: 20M/933M
[INFO] ------------------------------------------------------------------------
[INFO] Shutdown detected, destroying JMeter process...
Note that there will be a BUILD SUCCESS, even if there are 100% Errors. Therefore, we need to check the number of errors (0,00%) in our case; see above.
Step 7: Connect to Jenkins
Step 7.1: Start Jenkins in interactive Terminal Mode
Make sure that port 8080 is unused on the Docker host. If you were following all steps in part 1 of the series, you might need to stop cadvisor:
(dockerhost)$ sudo docker stop cadvisor
I assume that jenkins_home is already created, all popular plugins are installed and an Admin user has been created as shown in part 1 of the blog series. We start the Jenkins container with the jenkins_home Docker host volume mapped to /var/jenkins_home:
(dockerhost)$ cd <path_to_jenkins_home> # in my case: cd /vagrant/jenkins_home/
(dockerhost:jenkins_home)$ sudo docker run -it --rm --name jenkins -p8080:8080 -p50000:50000 -v`pwd`:/var/jenkins_home jenkins
Running from: /usr/share/jenkins/jenkins.war
...
--> setting agent port for jnlp
--> setting agent port for jnlp... done
Step 7.2: Open Jenkins in a Browser
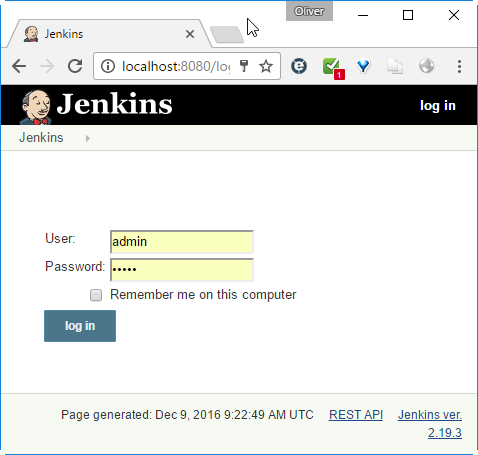
Now we want to connect to the Jenkins portal. For that, open a browser and open the URL
<your_jenkins_host>:8080
In our case, Jenkins is running in a container and we have mapped the container-port 8080 to the local port 8080 of the Docker host. On the Docker host, we can open the URL.
localhost:8080
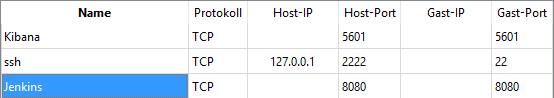
Note: In case of Vagrant with VirtualBox, per default, there is only a NAT-based interface and you need to create port-forwarding for any port you want to reach from outside (also the local machine you are working on is to be considered as outside). In this case, we need to add an entry in the port forwarding list of VirtualBox:
Note that this configuration is not permanent, unless you define the port mappings in the Vagrantfile as follows (see official Vagrant documentation):
config.vm.network "forwarded_port", guest: 8080, host: 8080
Log in with the admin account we have created in part 1 of the blog post series:
Step 8: Run the Server JAR File on Jenkins
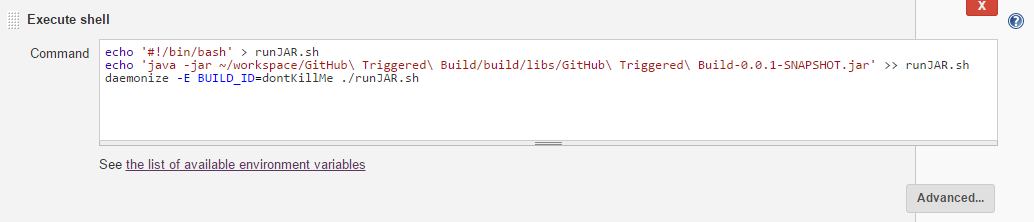
Inour case, the software we are building is a server listening on port 2005. Since we do not want the Jenkins pipeline to depend on any externally started server process, we now will make sure that a server instance is started automatically in the background during the build process. We will
- start the server in background
- perform the tests in the next step
- stop the server (is done by Jenkins automatically at the end of the build process)
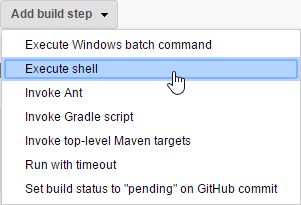
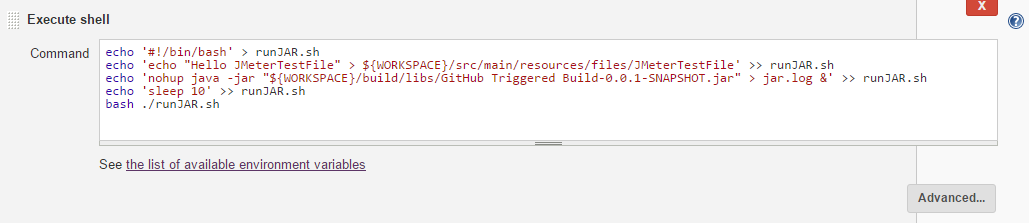
For that, we create a shell script that runs the server jar file in the background.
On the Jenkins server, goto:
See the shell script here:
echo '#!/bin/bash' > runJAR.sh
echo 'echo "Hello JMeterTestFile" > "${WORKSPACE}/src/main/resources/files/JMeterTestFile"' >> runJAR.sh
echo 'nohup java -jar "${WORKSPACE}/build/libs/GitHub Triggered Build-0.0.1-SNAPSHOT.jar" > jar.log &' >> runJAR.sh
echo 'sleep 10' >> runJAR.sh
bash ./runJAR.sh
The second echo command makes sure the JMeterTestFile exists on the server. This file is the one we will retrieve with the GET commands (this is specific for the server software we use).
After clicking
-> Click on build job
-> ![]() ,
,
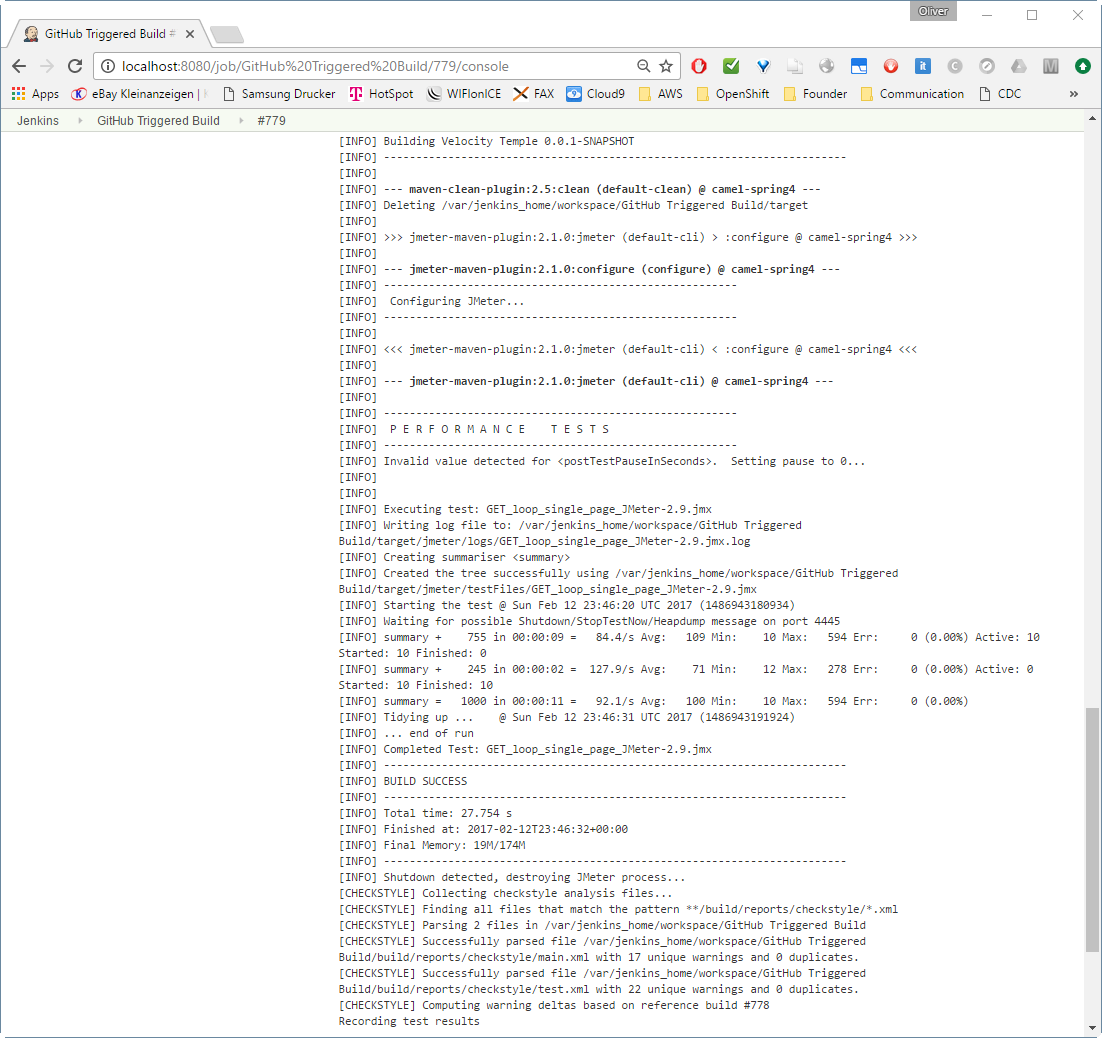
we will see following log:
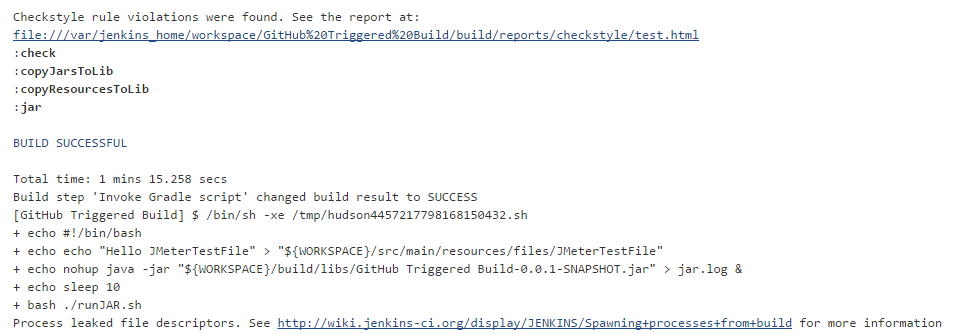
Here we can see, that the runJar.sh command has been started.
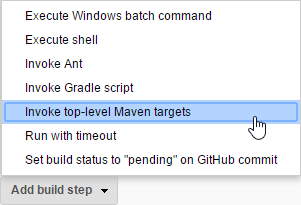
Step 9: Run the Maven JMeter Plugin within Jenkins
Let us run JMeter using Maven. For that, we go to
-> Jenkins
-> your project
-> ![]()
-> Build -> ![]()
-> 
-> ![]()
-> ![]()
-> ![]()
We have added a „clean“ Maven goal in order to remove any previously added JMX files.
Then test the configuration via
-> your project
-> ![]()
-> Build History -> click on running build
-> ![]()
After a long period of downloads, at the end you should see a SUCCESS statement:
Step 10: Collect the Performance Reports
In this step, we will install and configure the Jenkins JMeter plugin in order to collect the JMeter performance reports
Step 10.1: Install the Jenkins JMeter Plugin
Log into Jenkins as admin. Then goto
-> Manage Jenkins
-> Manage Plugins
–> Available
–> enter „JMeter“ in the search field
-> check the Install checkmark
-> ![]()
-> Choose „Restart Jenkins“
The plugin is visible now on the Installed tab:

Step 10.2: Configure Jenkins to collect the Performance Reports
Now is the time to trigger the creation of the performance reports. For that, let us choose
-> Your Project
-> ![]()
-> 
-> 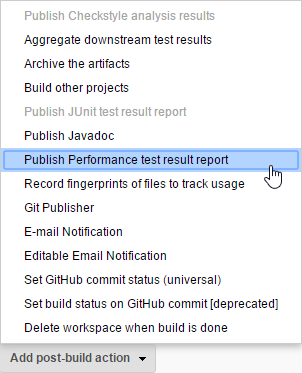
->  (in case the results are in CSV, choose JMeterCSV instead)
-> Performance Report: **/*.jtl
-> ![]()
For a manual test, just press
-> ![]()
At the end, you should see Performance Trend graphs like follows:
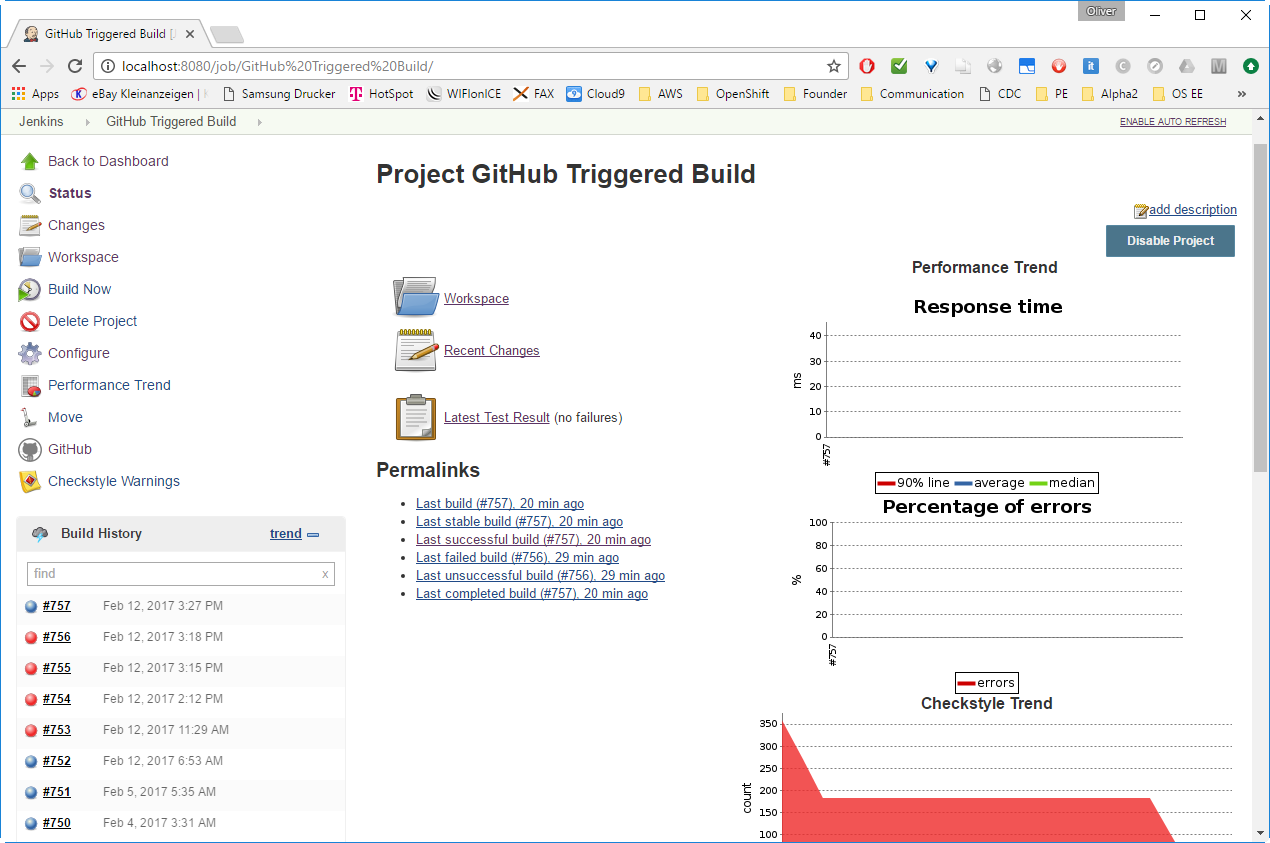
Okay, but where are the lines showing 90% average and median values? Will they appear after the next build? Let us try:
-> ![]()
Yes, the lines appear only after the second JMeter performance measurement. See here an example after the third measurement:
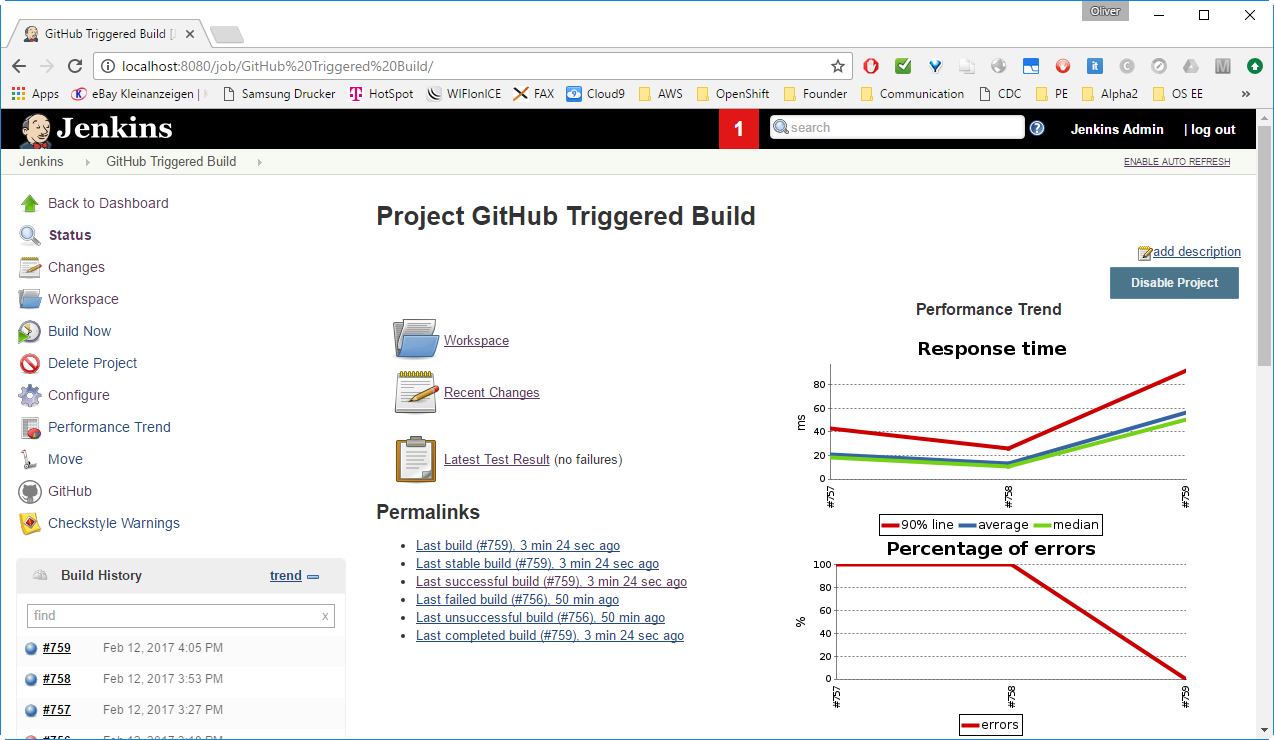
After a few test cycles, the test report might look like follows:
Appendix A: Error in NonGUIDriver java.lang.NullPointerException
Symptoms:
JMeter plugin v2.1, Jmeter version defined to be 3.1; Jmeter config file (.jmx) created with a JMeter v3.1 GUI
After mvn jmeter:jemeter, we see the error message
Error in NonGUIDriver java.lang.NullPointerException
In the logs we see messages like:
...
2017/02/11 12:27:43 WARN  - jmeter.save.SaveService: Bad _version - expected 2.4, found 3.1.
...
2017/02/11 12:27:43 ERROR - jmeter.save.SaveService: Conversion error com.thoughtworks.xstream.converters.ConversionException: No field 'sentBytes' found in class 'org.apache.jmeter.samplers.SampleSaveConfiguration' : No field 'sentBytes' found in class 'org.apache.jmeter.samplers.SampleSaveConfiguration'
...
Full logs:
1) Command line:
$ mvn jmeter:jmeter
[INFO] Scanning for projects...
[INFO]
[INFO] ------------------------------------------------------------------------
[INFO] Building Velocity Temple 0.0.1-SNAPSHOT
[INFO] ------------------------------------------------------------------------
[INFO]
[INFO] >>> jmeter-maven-plugin:2.1.0:jmeter (default-cli) > :configure @ camel-spring4 >>>
[INFO]
[INFO] --- jmeter-maven-plugin:2.1.0:configure (configure) @ camel-spring4 ---
[INFO] -------------------------------------------------------
[INFO] Configuring JMeter...
[INFO] -------------------------------------------------------
[INFO]
[INFO] <<< jmeter-maven-plugin:2.1.0:jmeter (default-cli) < :configure @ camel-spring4 <<<
[INFO]
[INFO] --- jmeter-maven-plugin:2.1.0:jmeter (default-cli) @ camel-spring4 ---
[INFO]
[INFO] -------------------------------------------------------
[INFO] P E R F O R M A N C E T E S T S
[INFO] -------------------------------------------------------
[INFO] Invalid value detected for <postTestPauseInSeconds>. Setting pause to 0...
[INFO]
[INFO]
[INFO] Executing test: GET Requests.jmx
[INFO] Error in NonGUIDriver java.lang.NullPointerException
[INFO] Completed Test: GET Requests.jmx
[INFO]
[INFO] Executing test: POST Requests.jmx
[INFO] Error in NonGUIDriver java.lang.NullPointerException
[INFO] Completed Test: POST Requests.jmx
[INFO] ------------------------------------------------------------------------
[INFO] BUILD SUCCESS
[INFO] ------------------------------------------------------------------------
[INFO] Total time: 11.172 s
[INFO] Finished at: 2017-02-11T12:27:44+01:00
[INFO] Final Memory: 20M/933M
[INFO] ------------------------------------------------------------------------
[INFO] Shutdown detected, destroying JMeter process...
[INFO] Shutdown detected, destroying JMeter process...
Log file:
2017/02/11 12:27:42 INFO - jmeter.util.JMeterUtils: Setting Locale to de_DE
2017/02/11 12:27:43 INFO - jmeter.util.JMeterUtils: Could not find resources for 'de_DE', using 'de'
2017/02/11 12:27:43 INFO - jmeter.JMeter: Loading user properties from: C:\Users\olive\git\simple-restful-file-storage\target\jmeter\bin\user.properties
2017/02/11 12:27:43 INFO - jmeter.JMeter: Loading system properties from: C:\Users\olive\git\simple-restful-file-storage\target\jmeter\bin\system.properties
2017/02/11 12:27:43 WARN - jmeter.JMeter: LogLevel: DEBUG
2017/02/11 12:27:43 INFO - jmeter.JMeter: Copyright (c) 1998-2013 The Apache Software Foundation
2017/02/11 12:27:43 INFO - jmeter.JMeter: Version 2.9 r1437961
2017/02/11 12:27:43 INFO - jmeter.JMeter: java.version=1.8.0_101
2017/02/11 12:27:43 INFO - jmeter.JMeter: java.vm.name=Java HotSpot(TM) 64-Bit Server VM
2017/02/11 12:27:43 INFO - jmeter.JMeter: os.name=Windows 10
2017/02/11 12:27:43 INFO - jmeter.JMeter: os.arch=amd64
2017/02/11 12:27:43 INFO - jmeter.JMeter: os.version=10.0
2017/02/11 12:27:43 INFO - jmeter.JMeter: file.encoding=Cp1252
2017/02/11 12:27:43 INFO - jmeter.JMeter: Default Locale=Deutsch (Deutschland)
2017/02/11 12:27:43 INFO - jmeter.JMeter: JMeter Locale=Deutsch (Deutschland)
2017/02/11 12:27:43 INFO - jmeter.JMeter: JMeterHome=C:\Users\olive\git\simple-restful-file-storage\target\jmeter
2017/02/11 12:27:43 INFO - jmeter.JMeter: user.dir =C:\Users\olive\git\simple-restful-file-storage\target\jmeter\bin
2017/02/11 12:27:43 INFO - jmeter.JMeter: PWD =C:\Users\olive\git\simple-restful-file-storage\target\jmeter\bin
2017/02/11 12:27:43 INFO - jmeter.JMeter: IP: 192.168.178.212 Name: LAPTOP-P5GHOHB7 FullName: LAPTOP-P5GHOHB7.fritz.box
2017/02/11 12:27:43 INFO - jmeter.services.FileServer: Default base='C:\Users\olive\git\simple-restful-file-storage\target\jmeter\bin'
2017/02/11 12:27:43 INFO - jmeter.services.FileServer: Set new base='C:\Users\olive\git\simple-restful-file-storage\target\jmeter\testFiles'
2017/02/11 12:27:43 INFO - jmeter.JMeter: Loading file: C:\Users\olive\git\simple-restful-file-storage\target\jmeter\testFiles\GET Requests.jmx
2017/02/11 12:27:43 INFO - jmeter.save.SaveService: Testplan (JMX) version: 2.2. Testlog (JTL) version: 2.2
2017/02/11 12:27:43 INFO - jmeter.save.SaveService: Using SaveService properties file encoding UTF-8
2017/02/11 12:27:43 INFO - jmeter.save.SaveService: Using SaveService properties version 3.1
2017/02/11 12:27:43 WARN - jmeter.save.SaveService: Bad _version - expected 2.4, found 3.1.
2017/02/11 12:27:43 INFO - jmeter.save.SaveService: All converter versions present and correct
2017/02/11 12:27:43 INFO - jmeter.protocol.http.sampler.HTTPSamplerBase: Parser for text/html is org.apache.jmeter.protocol.http.parser.LagartoBasedHtmlParser
2017/02/11 12:27:43 INFO - jmeter.protocol.http.sampler.HTTPSamplerBase: Parser for application/xml is org.apache.jmeter.protocol.http.parser.LagartoBasedHtmlParser
2017/02/11 12:27:43 INFO - jmeter.protocol.http.sampler.HTTPSamplerBase: Parser for text/xml is org.apache.jmeter.protocol.http.parser.LagartoBasedHtmlParser
2017/02/11 12:27:43 INFO - jmeter.protocol.http.sampler.HTTPSamplerBase: Parser for text/vnd.wap.wml is org.apache.jmeter.protocol.http.parser.RegexpHTMLParser
2017/02/11 12:27:43 INFO - jmeter.protocol.http.sampler.HTTPSamplerBase: Parser for text/css is org.apache.jmeter.protocol.http.parser.CssParser
2017/02/11 12:27:43 INFO - jmeter.protocol.http.sampler.HTTPSamplerBase: Reuse SSL session context on subsequent iterations: true
2017/02/11 12:27:43 ERROR - jmeter.save.SaveService: Conversion error com.thoughtworks.xstream.converters.ConversionException: No field 'sentBytes' found in class 'org.apache.jmeter.samplers.SampleSaveConfiguration' : No field 'sentBytes' f
ound in class 'org.apache.jmeter.samplers.SampleSaveConfiguration'
---- Debugging information ----
message : No field 'sentBytes' found in class 'org.apache.jmeter.samplers.SampleSaveConfiguration'
cause-exception : com.thoughtworks.xstream.converters.reflection.MissingFieldException
cause-message : No field 'sentBytes' found in class 'org.apache.jmeter.samplers.SampleSaveConfiguration'
class : org.apache.jmeter.samplers.SampleSaveConfiguration
required-type : org.apache.jmeter.samplers.SampleSaveConfiguration
converter-type : org.apache.jmeter.save.converters.SampleSaveConfigurationConverter
path : /jmeterTestPlan/hashTree/hashTree/hashTree/ResultCollector/objProp/value/sentBytes
line number : 97
class[1] : org.apache.jmeter.testelement.property.ObjectProperty
converter-type[1] : com.thoughtworks.xstream.converters.reflection.ReflectionConverter
class[2] : org.apache.jmeter.reporters.ResultCollector
converter-type[2] : org.apache.jmeter.save.converters.TestElementConverter
class[3] : org.apache.jorphan.collections.ListedHashTree
converter-type[3] : org.apache.jmeter.save.converters.HashTreeConverter
------------------------------- : No field 'sentBytes' found in class 'org.apache.jmeter.samplers.SampleSaveConfiguration' : No field 'sentBytes' found in class 'org.apache.jmeter.samplers.SampleSaveConfiguration'
Resolution:
The problem is caused by the config file (.jmx) being created with JMeter version 3.1, but Maven using JMeter Version 2.9.
Download and extract Apache JMeter version 2.9 from here. Use this version of Apache JMeter to create the JMX file you later use in the Maven JMeter plugin.
Summary
In this blog post, we have learned how to
- Installed JMeter locally
- Copied and adapted a base test plan
- Tested the JMeter performance tests locally
- Integrated JMeter into Maven (helps to automatically download and spin up JMeter on Jenkins)
- Started the server on Jenkins in the Background
- Run JMeter on Jenkins using Maven
- Collected the created Performance Reports using the Jenkins JMeter plugin
After I have found out that the latest Maven JMeter plugin version is using an older JMeter version than the one I had used to create the test plan, and that the test plan is not backwards compatible (see appendix A), the installation process was straightforward.
Note that the performance tests put quite a bit of strain to your Jenkins server. In this blog post, the software as well as the JMeter process are run on the same machine. Looking at my own system, ~70% of the CPU was consumed by the server, while JMeter got the rest during a performance measurement. In a professional environment, you will want to run the server on a separate environment with defined resource constraints that are not shared with other processes. Moreover, you need to make sure that the JMeter measurements are not limited by the resources of the measuring device; i.e. you need to carefully monitor the resources consumed by JMeter itself.
Further Reading
- Jenkins Homepage
- German blog post about how to use Maven JMeter Plugin within Jenkins
- Blog post on how to test REST Services using a local JMeter installation
- Blog post describing how runtime variables can be used on the command line interface: See end of step 3 above.
- BlazeMeter: Continuous Integration 101: How to Run JMeter With Jenkins: shows how to run JMeter from Jenkins without going through the hassle of Maven integration. In this blog post, we have preferred to use Maven, since it will automatically download and install JMeter on Jenkins.