Find below quick step by step instructions on how to debug Angular applications with Visual Studio Code.
Versions
- Tested on Visual Studio Code v1.52.1 on CentOS 7 (more recent versions do not work on CentOS 7)
tldr;
- Ctrl-Shift+` & Create JavaScript Debug Terminal
npm run testor:ng serve --port=8080with F5 + Launch Chrome- set breakpoints (left of the line numbers of the code editor)
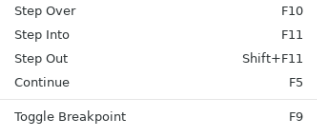
- Navigate through the code:
- F10: Step Over
- F11: Step Into
- Shift+F11: Step Out
- F5: Continue
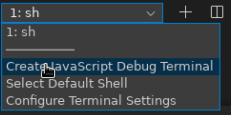
Step 1: start JavaScript Debug Terminal
- Menu –> Terminal –> New Terminal (Shortcut: Ctrl-Shift+`)
- on drop down menu in the terminal tab (showing
1: shor1: bashor1: cmd):
–> Create JavaScript Debug Terminal
Step 2a: Run Unit Tests
- In the debug terminal:
npm run test
–> the debugger automatically connects to the application
Step 2b: Run the Application
Alternatively start the Angular application and debug it via Chrome:
ng serve --port=8080
Port8080is the default port used in the Chrome debugger config below; however, you can edit it via Menu -> Run -> Open Configurations to match theng servedefault of4200- wait until you see „: Compiled successfully.“
- Menu –> Run –> Start Debugging (Shortcut: F5)
- –> Chrome
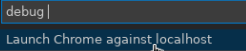
- A browser opens on localhost:8080
- Use the application as appropriate
Step 3: Set Breakpoints
- Breakpoints can be set in the code left of the editor (a non-solid white on black or a solid red circle appears)

or

–> once the application hits the breakpoint, the debugger waits for additional instructions to navigate through the code.
Step 4: Navigate through the Code
- Debugging Shortcuts