In this article, we will learn how to perform Kubernetes Monitoring based on the Kubernetes Metrics Server. We will install a metrics server that helps to monitor the CPU and RAM usage of cluster nodes and its PODs.
References
Step 0: Preparation
Step 0.1: Access the Kubernetes Playground
As always, we start by accessing the Katacoda Kubernetes Playground.
Step 0.2 (optional): Configure auto-completion
The Katacoda Kubernetes Playground has defined the alias and auto-completion already. Only in case you are running your tests in another environment, we recommend to issue the following two commands:
alias k=kubectl
source <(kubectl completion bash)
However, even in case of the Katacoda Kubernetes Playground, auto-completion does not work for the alias k for yet. Therefore, we need to type the following command:
source <(kubectl completion bash | sed 's/kubectl/k/g')
Once this is done, k g<tab> will be auto-completed to k get and k get pod <tab> will reveal the name(s) of the available POD(s).
Step 1: Download the Metrics Server v0.3.6
We clone the metrics server via GIT:
git clone https://github.com/vocon-it/metrics-server
Note: The original metrics server’s code can be found on the GIT Repo /metrics-server. However, we have found that the current master did not work (issue #152 + a problem with secure API access), so we had to go back to release v0.3.6. Moreover, we have added a bootup change of the POD from the upstream linuxacademy repo.
Step 2: Install Kubernetes Metrics Server
We install the metrics server on our Kubernetes cluster like follows:
kubectl apply -f ./metrics-server/deploy/1.8+/

# output:
clusterrole.rbac.authorization.k8s.io/system:aggregated-metrics-reader created
clusterrolebinding.rbac.authorization.k8s.io/metrics-server:system:auth-delegator created
rolebinding.rbac.authorization.k8s.io/metrics-server-auth-reader created
apiservice.apiregistration.k8s.io/v1beta1.metrics.k8s.io created
serviceaccount/metrics-server created
deployment.extensions/metrics-server created
service/metrics-server created
clusterrole.rbac.authorization.k8s.io/system:metrics-server created
clusterrolebinding.rbac.authorization.k8s.io/system:metrics-server created
Step 3 (optional): Check API
The metrics server extends the Kubernetes API. This can be verified by looking at the raw API response:
kubectl get --raw /apis/metrics.k8s.io/

# output:
{"kind":"APIGroup","apiVersion":"v1","name":"metrics.k8s.io","versions":[{"groupVersion":"metrics.k8s.io/v1beta1","version":"v1beta1"}],"preferredVersion":{"groupVersion":"metrics.k8s.io/v1beta1","version":"v1beta1"}}
Step 4: Check Node’s CPU + RAM
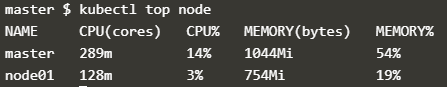
We get the CPU and memory utilization of the nodes in your cluster.
kubectl top node
# output: error: metrics not available yet
If you get the answer, that the metrics are not available yet, then wait and try again. You can also check the status of the metrics Deployment and POD, Check the deployment and the POD respectively, and try again:
kubectl get deploy metrics-server -n kube-system
NAME             READY   UP-TO-DATE   AVAILABLE   AGE
metrics-server   1/1     1            1           4m36s

kubectl get pods -n kube-system | grep metrics
metrics-server-65986c6dff-59q9z           1/1     Running            0          77s

kubectl top node
# output:
NAME     CPU(cores)   CPU%   MEMORY(bytes)   MEMORY%
master   117m         5%     997Mi           52%
node01   69m          1%     875Mi           22%
Step 5: Check POD’s CPU + RAM
To get the CPU and memory utilization, call the top pods command:
kubectl top pods

# output: <none>
In this case, there is no output, since there is no POD in the default namespace. However, we can get the CPU and memory of pods in all namespaces with the following option:
kubectl top pods --all-namespaces

# output:
NAMESPACE     NAME                                    CPU(cores)   MEMORY(bytes)
kube-system   coredns-fb8b8dccf-dxgq6                 3m           7Mi
kube-system   coredns-fb8b8dccf-zp6qj                 3m           7Mi
kube-system   etcd-master                             19m          55Mi
kube-system   katacoda-cloud-provider-8fb8484-t92ln   0m           0Mi
kube-system   kube-apiserver-master                   23m          246Mi
kube-system   kube-controller-manager-master          23m          44Mi
kube-system   kube-keepalived-vip-2czgr               2m           9Mi
kube-system   kube-proxy-6wfxn                        1m           10Mi
kube-system   kube-proxy-nk8sl                        1m           7Mi
kube-system   kube-scheduler-master                   2m           10Mi
kube-system   metrics-server-855bb59dd8-5mhgx         1m           12Mi
kube-system   weave-net-gmqxn                         3m           85Mi
kube-system   weave-net-r9fgt                         1m           74Mi
We can also get the CPU and memory of pods in only one namespace (here, we have chosen the kube-system namespace):
kubectl top pods -n kube-system

# output:
NAME                                    CPU(cores)   MEMORY(bytes)
coredns-fb8b8dccf-dxgq6                 4m           7Mi
coredns-fb8b8dccf-zp6qj                 3m           7Mi
etcd-master                             18m          56Mi
katacoda-cloud-provider-8fb8484-t92ln   0m           0Mi
kube-apiserver-master                   25m          246Mi
kube-controller-manager-master          25m          44Mi
kube-keepalived-vip-2czgr               2m           9Mi
kube-proxy-6wfxn                        1m           10Mi
kube-proxy-nk8sl                        3m           7Mi
kube-scheduler-master                   2m           10Mi
metrics-server-855bb59dd8-5mhgx         1m           12Mi
weave-net-gmqxn                         1m           84Mi
weave-net-r9fgt                         3m           74Mi
Step 6: Filter POD Information
In this step, we will show, how you can filter POD information based on different parameters:
- per namespace: per default, the POD information is filtered based on namespace. As we have seen above, the option
--all-namespacesswitches off this filtering mechanism. - per label value
- per POD name
We can also filter the PODs based on label values. The first command has no output since there is no POD in the default namespace with the corresponding label.
kubectl top pod -l label=value
#output: <none>
Step 6.1: Filter per Label and Namespace
Therefore, we have chosen the kube-system namespace and a label that should provide you with some output.
kubectl top pod -l component=kube-scheduler -n kube-system
NAME                    CPU(cores)   MEMORY(bytes)
kube-scheduler-master   2m           10Mi
Step 6.2: Filter per Label only
The label filter works also across all namespaces if needed:
kubectl top pod -l component=kube-scheduler --all-namespaces
NAMESPACE     NAME                    CPU(cores)   MEMORY(bytes)
kube-system   kube-scheduler-master   2m           10Mi
Step 6.3: Filter per POD Name
It is also possible to get the CPU and memory of a specific pod:
kubectl top pod etcd-master -n kube-system
NAME          CPU(cores)   MEMORY(bytes)
etcd-master   16m          57Mi
Step 7: Display additional Container Information
Per-container details are provided if we add the --containers option:
kubectl top pod etcd-master -n kube-system --containers
POD           NAME   CPU(cores)   MEMORY(bytes)
etcd-master   etcd   17m          57Mi

kubectl top pods --all-namespaces --containers
NAMESPACE     POD                               NAME                      CPU(cores)   MEMORY(bytes)
kube-system   coredns-fb8b8dccf-dxgq6           coredns                   4m           7Mi
kube-system   coredns-fb8b8dccf-zp6qj           coredns                   3m           7Mi
kube-system   etcd-master                       etcd                      16m          56Mi
kube-system   kube-apiserver-master             kube-apiserver            28m          217Mi
kube-system   kube-controller-manager-master    kube-controller-manager   24m          44Mi
kube-system   kube-keepalived-vip-2czgr         kube-keepalived-vip       2m           9Mi
kube-system   kube-proxy-6wfxn                  kube-proxy                2m           10Mi
kube-system   kube-proxy-nk8sl                  kube-proxy                3m           7Mi
kube-system   kube-scheduler-master             kube-scheduler            2m           10Mi
kube-system   metrics-server-855bb59dd8-5mhgx   metrics-server            1m           11Mi
kube-system   weave-net-gmqxn                   weave                     1m           52Mi
kube-system   weave-net-gmqxn                   weave-npc                 0m           31Mi
kube-system   weave-net-r9fgt                   weave-npc                 0m           32Mi
kube-system   weave-net-r9fgt                   weave                     1m           41Mi
Above, we can see an additional column for the name of the container, and the CPU and MEMORY are displayed per container instead of per POD.
Further Reading
- Kubernetes Web UI (Dashboard) depends on the Kubernetes Metrics Server. This Replex Blog Post seems to provide a good guide on how to install the Kubernetes Web UI and Metrics Server.
Summary
In this article, we have learned how to monitor CPU and Memory resources of cluster nodes and applications. We have installed a metrics server to monitor the CPU and Memory consumption of cluster nodes and PODs.