This is part 2 of a series on Kubernetes a la minikube. Minikube is (probably) the easiest way of installing a small Kubernetes system including a graphical user interface. In part 1 we have shown how to install such a system on a fresh CentOS Linux system. In this part, we will create our first Hello World Kubernetes Service accessible from the Internet.

For that, we will create a kubernetes deployment, which automatically creates a POD with a single Docker container. Then, we create a Kubernetes Service of type NodePort, which is accessible from the outside world.
In the appendix, we will show, how to tweak the automatically generated kubernetes dashboard service, so we can reach it from the Internet.
Within this blog post, we will work on minikube installed on a fresh CentOS cloud system we have installed in part 1 of this series.

Step 0: Get Access to a Minishift Installation
One way of achieving this step is to follow steps 1 to 4 of part 1 of this series. However, there are other possibilities to get access to Kubernetes systems as well. For example, you may want to access a Minishift installation as provided by Ben Hall on his Katacoda platform. Check out e.g. the tutorial „Launch A Single Node Cluster„.
Step 1 (optional): Explore the Status
To get acquainted with your minikube installation, you may repeat step 5 of part 1 of this series and run the commands
kubectl version
kubectl cluster-info
kubectl get nodes
Step 2: Create an Application: Deployment vs POD
In Kubernetes, there are, among others, two ways of creating application containers:
- creating POD directly
- creating POD via deployments (recommended)
Step 2.1: Creating a POD directly
Even though it is not recommended for most cases (see a discussion of this topic on StackOverflow) we can create a POD directly like follows:
Create a single POD:
cat <<EOF | kubectl create -f -
apiVersion: v1
kind: Pod
metadata:
  name: nginx
spec:
  containers:
  - name: nginx
    image: nginx
EOF
This will create a pod as expected:
# kubectl get pods
NAME                                    READY   STATUS    RESTARTS   AGE
nginx                                   1/1     Running   1          24m
Note that it is not possible to create a POD with a kubectl create pod command (crossed out for not confusing the quick reader). Above, we had to create it by reading in a YAML file instead.
kubectl create pod mypod --image=nginx
Note also that the POD is restarted, if a container process is killed:
# ps -ef | grep nginx | grep -v grep
root     30466 30450  0 22:13 ?        00:00:00 nginx: master process nginx -g daemon off;
101      31744 30466  0 22:16 ?        00:00:00 nginx: worker process
# kill -9 31744 30466
# ps -ef | grep nginx
root     31950 31934  0 22:17 ?        00:00:00 nginx: master process nginx -g daemon off;
101      31965 31950  0 22:17 ?        00:00:00 nginx: worker process
In that sense, the POD we have created directly seems to be durable, even though the discussions below may hint into another direction: they say that only a deployment will restart a POD if it fails. Since we only have a single node cluster, we cannot test, whether a POD is created on another node, if a node fails.
Step 2.2: Creating a POD via a Deployment (recommended)
The recommended way of creating a POD is to create a deployment. Why? What is the difference between creating a deployment and creating a pod? What is a deployment, anyway? For an answer to that, let us consult google:
What is a kubernetes deployment?Google: A Deployment runs multiple replicas of your application and automatically replaces any instances that fail or become unresponsive. In this way, Deployments help ensure that one or more instances of your application are available to serve user requests. Deployments are managed by the Kubernetes Deployment controller.
Okay, when we create a deployment and tell the deployment to create 5 replicas of a POD, this is different from just creating 5 replicas of a POD, because a deployment will restart PODs that have failed. Let us test this.
Most tutorials do that with commands as follows:
kubectl run first-deployment --image=katacoda/docker-http-server --port=80
### output:
kubectl run --generator=deployment/apps.v1beta1 is DEPRECATED and will be removed in a future version. Use kubectl create instead.
deployment.apps/first-deployment created
However, as there is a hint that this kind of commands is deprecated, let us create the deployment differently:
If you have done so, and you want to test the recommended way, let us delete the deployment again:
kubectl delete deployment first-deployment
Now we can create the deployment in the recommended way:
cat <<EOF | kubectl create -f -
apiVersion: extensions/v1beta1
kind: Deployment
metadata:
  annotations:
    deployment.kubernetes.io/revision: "1"
  creationTimestamp: 2018-11-19T21:55:59Z
  generation: 1
  labels:
    run: first-deployment
  name: first-deployment
  namespace: default
  resourceVersion: "300379"
  selfLink: /apis/extensions/v1beta1/namespaces/default/deployments/first-deployment
spec:
  progressDeadlineSeconds: 600
  replicas: 1
  revisionHistoryLimit: 2
  selector:
    matchLabels:
      run: first-deployment
  strategy:
    rollingUpdate:
      maxSurge: 25%
      maxUnavailable: 25%
    type: RollingUpdate
  template:
    metadata:
      creationTimestamp: null
      labels:
        run: first-deployment
    spec:
      containers:
      - image: katacoda/docker-http-server
        imagePullPolicy: Always
        name: first-deployment
        ports:
        - containerPort: 80
          protocol: TCP
        resources: {}
        terminationMessagePath: /dev/termination-log
        terminationMessagePolicy: File
      dnsPolicy: ClusterFirst
      restartPolicy: Always
      schedulerName: default-scheduler
      securityContext: {}
      terminationGracePeriodSeconds: 30
EOF

# output:
# deployment.extensions/first-deployment created
To be honest, I have liked the kubectl run command more…
😉
The reason for the depreciation is discussed in this StackOverflow Q&A.
Step 3 (optional): Explore Docker processes, PODs, and Services
This is creating two docker containers: a „pause“ container per POD and the service container in the POD:
# docker ps | grep "^CONTAINER\|deployment"
CONTAINER ID        IMAGE                                     COMMAND                  CREATED             STATUS              PORTS               NAMES
af733dc6244c        katacoda/docker-http-server               "/app"                   18 hours ago        Up 18 hours                             k8s_first-deployment_first-deployment-59f6bb4956-fqrhd_default_b17c0c0c-e9ee-11e8-bccd-9600001441cb_0
bd1e5b869266        k8s.gcr.io/pause-amd64:3.1                "/pause"                 18 hours ago        Up 18 hours                             k8s_POD_first-deployment-59f6bb4956-fqrhd_default_b17c0c0c-e9ee-11e8-bccd-9600001441cb_0
This is quite similar to what is created with the ‚oc new-app‘ command on an OpenShift installation. See e.g. our blog post Getting started with OpenShift. But not quite: here, the service has not yet been created, as can be seen below.
We can see, that no service is created by deployment:
# kubectl get svc
NAME         TYPE        CLUSTER-IP   EXTERNAL-IP   PORT(S)   AGE
kubernetes   ClusterIP   10.96.0.1            443/TCP   4h
However, we will find that a POD is created:
# kubectl get pod
NAME                                READY   STATUS    RESTARTS   AGE
first-deployment-59f6bb4956-fqrhd   1/1     Running   0          17h
To see the services or pods of all namespaces, you also can use the –all-namespaces option:
# kubectl get pod --all-namespaces
NAMESPACE     NAME                                    READY   STATUS    RESTARTS   AGE
default       first-deployment-59f6bb4956-fqrhd       1/1     Running   0          18h
kube-system   coredns-c4cffd6dc-r8vg4                 1/1     Running   0          22h
kube-system   etcd-minikube                           1/1     Running   0          20h
kube-system   kube-addon-manager-minikube             1/1     Running   1          22h
kube-system   kube-apiserver-minikube                 1/1     Running   0          20h
kube-system   kube-controller-manager-minikube        1/1     Running   0          20h
kube-system   kube-dns-86f4d74b45-gghfb               3/3     Running   0          22h
kube-system   kube-proxy-fhls5                        1/1     Running   0          20h
kube-system   kube-scheduler-minikube                 1/1     Running   0          22h
kube-system   kubernetes-dashboard-6f4cfc5d87-tnl6r   1/1     Running   0          22h
kube-system   storage-provisioner                     1/1     Running   0          22h
and
# kubectl get svc --all-namespaces
NAMESPACE     NAME                   TYPE        CLUSTER-IP      EXTERNAL-IP   PORT(S)         AGE
default       kubernetes             ClusterIP   10.96.0.1               443/TCP         22h
kube-system   kube-dns               ClusterIP   10.96.0.10              53/UDP,53/TCP   22h
kube-system   kubernetes-dashboard   ClusterIP   10.101.34.253           80/TCP          22h
Here, we can see, that minikube has started a kubernetes dashboard and a DNS server in the kube-system namespace.
We can get even more details on the POD by using the describe command:
# kubectl describe pod first-deployment-59f6bb4956-fqrhd
Name:           first-deployment-59f6bb4956-fqrhd
Namespace:      default
Node:           minikube/159.69.221.89
Start Time:     Fri, 16 Nov 2018 23:26:42 +0100
Labels:         pod-template-hash=1592660512
                run=first-deployment
Annotations:
Status:         Running
IP:             172.17.0.6
Controlled By:  ReplicaSet/first-deployment-59f6bb4956
Containers:
  first-deployment:
    Container ID:   docker://af733dc6244ca05866d664729552a3db4070e8988337687e8a68948b72235a31
    Image:          katacoda/docker-http-server
    Image ID:       docker-pullable://katacoda/docker-http-server@sha256:76dc8a47fd019f80f2a3163aba789faf55b41b2fb06397653610c754cb12d3ee
    Port:           80/TCP
    Host Port:      0/TCP
    State:          Running
      Started:      Fri, 16 Nov 2018 23:26:45 +0100
    Ready:          True
    Restart Count:  0
    Environment:
    Mounts:
      /var/run/secrets/kubernetes.io/serviceaccount from default-token-lj5jx (ro)
Conditions:
  Type           Status
  Initialized    True
  Ready          True
  PodScheduled   True
Volumes:
  default-token-lj5jx:
    Type:        Secret (a volume populated by a Secret)
    SecretName:  default-token-lj5jx
    Optional:    false
QoS Class:       BestEffort
Node-Selectors:
Tolerations:     node.kubernetes.io/not-ready:NoExecute for 300s
                 node.kubernetes.io/unreachable:NoExecute for 300s
Events:
Even though the service is not yet exposed, we still can reach it from the Docker host: The Container IP address is 172.17.0.6, as we can read it from the output of the kubectl describe pod command above. The service is running on port 80. So, let us try to access the POD:
# curl 172.17.0.6:80
<h1>This request was processed by host: first-deployment-59f6bb4956-fqrhd</h1>
Note, however, that the POD IP address 172.17.0.6 is a private address that is not accessible from the outside world. In the next step, we will make sure that the service can be reached from the Internet as well.
Step 4: Expose the Service
Now, we want to expose the service to the outside world. Kubernetes knows three ways of doing this:
- exposing via ClusterIP:
reachable internally, only - exposing via NodePorts:
reachable internally and externally - exposing via LoadBalancers:
means of configuring cloud load balancers by way of labels See e.g. https://kubernetes.io/docs/concepts/services-networking/service/ for details on Kubernetes Load Balancer interaction.
The ClusterIP way is the default, but it is reachable from within the kubernetes network only. On the other hand, the LoadBalancer option works only in certain cloud environments. Therefore, we choose to expose the service via NodePort. This way, we can make the service reachable from the Internet and still need no external load balancers.
Let us now demonstrate the NodePorts ways of exposing a service.
Step 4.1: Exposing the Service via NodePorts
If the Node the service is running on has a publicly available IP address (mapped or not), we can access the service by exposing the deployment to a node port as follows:
kubectl expose deployment first-deployment --port=80 --type=NodePort
Since we have not added an option like --target-port=<static-port>, the port is allocated dynamically. Therefore, we decide to retrieve the port value from via kubectl as follows:
export PORT=$(kubectl get svc first-deployment -o go-template='{{range.spec.ports}}{{if .nodePort}}{{.nodePort}}{{"\n"}}{{end}}{{end}}')We need that information to access the service via curl:
# curl 127.0.0.1:$PORT
<h1>This request was processed by host: first-deployment-59f6bb4956-fqrhd</h1>
Since our Docker host is accessible from the Internet, we also can retrieve the same information from any browser on the Internet:
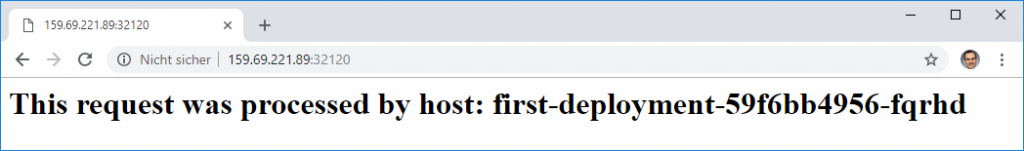
Okay, the random port is not nice. On the other hand, we cannot run all containers on the same well-known ports like port 80 (HTTP) or port 443 (HTTPS) by specifying the same target ports on the expose commands. This issue is something that can only be resolved with the help of a reverse proxy or an HTTP load balancer, which is out of scope for this blog post.
Summary
In this blog post, we have learned how to create, run, and access applications in a Kubernetes environment. For that, we have created Kubernetes PODs, Deployments and Services. We have learned that Deployments help with the management of PODs. E.g. they restart PODs if they fail.
Appendix: Make Kubernetes Dashboard available to the Internet
In part 1 of this series, we have accessed the Kubernetes Dashboard via an SSH tunnel. From a security perspective, this is a good solution, since you do not want the Internet to get access to your Kubernetes cluster.


However, for learning purposes, it is a good exercise to modify the kubernetes-dashboard service in a way that it is exposed to the Internet as well.
Let us explore the kubernetes-dashboard service as it comes with the minikube installation:
# kubectl get service kubernetes-dashboard -n=kube-system
NAME                   TYPE        CLUSTER-IP      EXTERNAL-IP   PORT(S)   AGE
kubernetes-dashboard   ClusterIP   10.101.34.253           80/TCP    4d
As pointed out in part 1 of this series, services of type ClusterIP are reachable Kubernetes-Cluster internal only. We just had tricked us a way into the cluster by creating an SSH tunnel to a cluster node.
Now, we have the task to change the type from ClusterIP to NodePort, so we can reach the service from the Internet. For that, we just edit the service as follows:
# kubectl edit service kubernetes-dashboard -n=kube-system
This will open an editor, and we can change the YAML file as shown below:
# kubectl get service kubernetes-dashboard -n=kube-system -o yaml
apiVersion: v1
kind: Service
metadata:
  annotations:
    kubectl.kubernetes.io/last-applied-configuration: |
      {"apiVersion":"v1","kind":"Service","metadata":{"annotations":{},"labels":{"addonmanager.kubernetes.io/mode":"Reconcile","app":"kubernetes-dashboard","kubernetes.io/minikube-addons":"dashboard","kubernetes.io/minikube-addons-endpoint":"dashboard"},"name":"kubernetes-dashboard","namespace":"kube-system"},"spec":{"ports":[{"port":80,"targetPort":9090}],"selector":{"app":"kubernetes-dashboard"}}}
  creationTimestamp: 2018-11-16T18:02:31Z
  labels:
    addonmanager.kubernetes.io/mode: Reconcile
    app: kubernetes-dashboard
    kubernetes.io/minikube-addons: dashboard
    kubernetes.io/minikube-addons-endpoint: dashboard
  name: kubernetes-dashboard
  namespace: kube-system
  resourceVersion: "391246"
  selfLink: /api/v1/namespaces/kube-system/services/kubernetes-dashboard
  uid: c9832a94-e9c9-11e8-bdae-9600001441cb
spec:
  clusterIP: 10.101.34.253
  externalTrafficPolicy: Cluster
  ports:
  - port: 80
    protocol: TCP
    targetPort: 9090
    nodePort: 30000           <----- add this line (optional)
  selector:
    app: kubernetes-dashboard
  sessionAffinity: None
  type: NodePort              <----- change from ClusterIP to NodePort
status:
  loadBalancer: {}
Note: the nodePort assignment (to 30000 in our case) is optional. You also can let the system allocate a dynamic port. If you have done so, you can retreive the port like we have shown in step 4.1 above:
export PORT=$(kubectl get svc kubernetes-dashboard -n=kube-system -o go-template='{{range.spec.ports}}{{if
After saving, the type of the service is changed and we can see the specified NodePort 30000:
# kubectl get service kubernetes-dashboard -n=kube-system
NAME                   TYPE       CLUSTER-IP      EXTERNAL-IP   PORT(S)        AGE
kubernetes-dashboard   NodePort   10.101.34.253                 80:30000/TCP   4d
Note: we also can review the current details of the service in a convenient way with the
-o yamloption:# kubectl get service kubernetes-dashboard -n=kube-system -o yaml apiVersion: v1 kind: Service ...
After having changed the service from type=ClusterIP to type=NodePort, we can access the service from outside:

Different from the screenshot at the beginning of this section, we can access the service directly on the public IP address: http://159.69.221.89:30000