In this article, we will have a look at Kubernetes logging. We will look, how Kubernetes logging is related to Docker logging.
References:
- kubernetes.io: Logging Architecture
- Docker Logging: A Complete Guide by sematext.com
- Docker’s official documentation on Logging
Step 0: Preparation
Step 0.1: Access the Kubernetes Playground
As always, we start by accessing the Katacoda Kubernetes Playground.
Step 0.2 (optional): Configure auto-completion
The Katacoda Kubernetes Playground has defined the alias and auto-completion already. Only in case you are running your tests in another environment, we recommend to issue the following two commands:
alias k=kubectl
source <(kubectl completion bash)
However, even in case of the Katacoda Kubernetes Playground, auto-completion does not work for the alias k for yet. Therefore, we need to type the following command:
source <(kubectl completion bash | sed 's/kubectl/k/g')
Once this is done, k g<tab> will be auto-completed to k get and k get pod <tab> will reveal the name(s) of the available POD(s).
If you want to change the context to a different namespace (so that you do not need the -n namespace for every command), the following functions comes handy:
kns ()
{
[ $# -eq 0 ] && kubectl config get-contexts | grep --color=auto '^\*' | awk '{print $5}' || kubectl config set-context $(kubectl config current-context) --namespace=$1
}
To show the current namespace, just type kns. To change to the namespace test-namespace, you just need to type:
kns test-namespace
Step 1: POD Level Logging (Basic Logging)
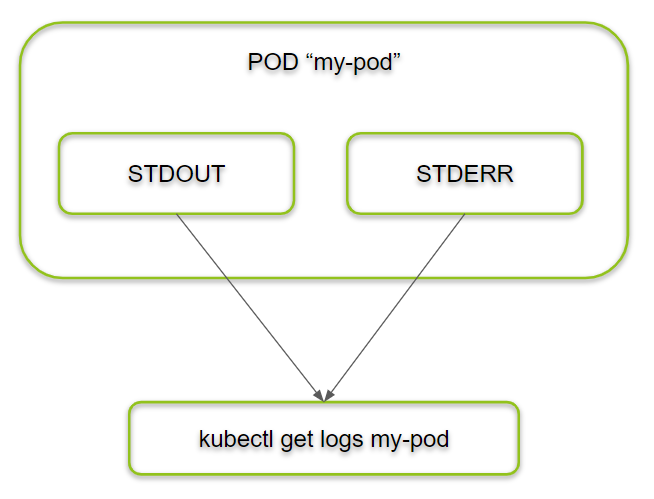
In Kubernetes, the default logging mechanism is to retrieve the STDOUT and STDERR stream of the application. To test this, let us create a POD that is sending one message per second to STDOUT and STDERR:
cat <<'EOF' | kubectl apply -f -
---
apiVersion: v1
kind: Pod
metadata:
  name: counter
spec:
  containers:
  - name: count
    image: ubuntu
    args: [/bin/bash, -c,
            'i=0; while true; do echo "STDOUT: $i: $(date)"; my-error; i=$((i+1)); sleep 1; done']
EOF

# output: pod/counter created
We can easily retrieve the logs with the following command:
kubectl logs counter
STDOUT: 0: Tue Nov 26 05:57:19 UTC 2019
/bin/bash: my-error: command not found
STDOUT: 1: Tue Nov 26 05:57:20 UTC 2019
/bin/bash: my-error: command not found
STDOUT: 2: Tue Nov 26 05:57:21 UTC 2019
/bin/bash: my-error: command not found
The lines in red are errors we have induced by purpose.
Note: Separate stdout and stderr log streams are supported in the kubelet, but they are not exposed from the kubelet’s http server upward (see issue 28167). Therefore, they cannot be easily separated using the
kubectl logscommand.If you need to discriminate between STDOUT and STDERR, you can pipe them in different files and retrieve them from there:
cat <<'EOF' | kubectl apply -f -
---
apiVersion: v1
kind: Pod
metadata:
  name: counter-stdout-stderr
spec:
  containers:
  - name: count
    image: ubuntu
    args: [/bin/bash, -c,
            '(i=0; while true; do echo "STDOUT: $i: $(date)"; my-error; i=$((i+1)); sleep 1; done) 1>> STDOUT.file 2>> STDERR.file']
EOF

# output: pod/counter-stdout-stderr created
kubectl logs will not produce any output now.
kubectl logs counter-stdout-stderr
# (no output ...)
Retrieve STDOUT:
kubectl exec -it counter-stdout-stderr -- tail STDOUT.file
STDOUT: 101: Tue Nov 26 06:53:05 UTC 2019
STDOUT: 102: Tue Nov 26 06:53:06 UTC 2019
STDOUT: 103: Tue Nov 26 06:53:07 UTC 2019
...
Retrieve STDERR:
kubectl exec -it counter-stdout-stderr -- tail STDERR.file
/bin/bash: my-error: command not found
/bin/bash: my-error: command not found
/bin/bash: my-error: command not found
...
Step 2: Node Level Logging
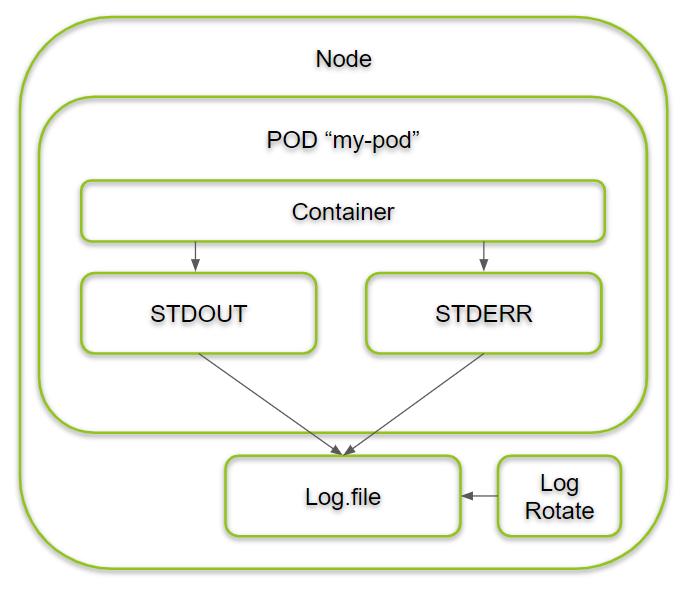
Each Container engine has its own way to handle logging on the node level. Here, we will look at the Docker engine loging only.
Step 2.1: Docker Logging
In this step, we will review Docker’s logging driver to log the application messages in json format to the Kubernetes node. We will also show, how to configure log rotation for Docker.
Step 2.2: Review the Default Docker Log Configuration
The current Docker log confiiguration can be found on /etc/docker/daemon.json:
sudo cat /etc/docker/daemon.json
{
  "exec-opts": ["native.cgroupdriver=systemd"],
  "log-driver": "json-file",
  "log-opts": {
    "max-size": "100m"
  },
  "storage-driver": "overlay2",
  "storage-opts": [
    "overlay2.override_kernel_check=true"
  ]
}
In this case, we have not changed the default configuration (as seen with Docker v19.03.11). We can see, that logs are formated as json files, and that the maximum size of each log file is 100 MB. What it does not say, is that the default amount of log files is 1 (for json-files):
Defaults:
- log-driver: json-file
- max-files: 1 for json-files, 5 for local (see here for json-file and here for local logging)
- max-size: 100 MB for json-files and 20 MB for local logging
-> max total size: 500 MB per container in our case (
So, be careful, if you are running many container workloads on disks with limited size.
All defaults for JSON FILE can be found on the official Docker Logging documentation. Information about logging drivers other than JSON FILE can be found via the navigation bar at the left side of the browser of the same page.
Default Location of Docker Logs
Just out of curiosity: where are the Docker Logs located by default? We found the answer by google, which is pointing to a Q&A of Docker Logging: A Complete Guide by sematext.com:
/var/lib/docker/containers/[container-id]/[container-id]-json.log.
So, let us check this:
tail -5 /var/lib/docker/containers/62a56c089a2f68a679b88d59bed15e0ecf46718ca7169adf16fa00e7897b4f91/62a56c089a2f68a679b88d59bed15e0ecf46718ca7169adf16fa00e7897b4f91-json.log
{"log":"WARN: 2020/12/23 20:30:42.678119 [allocator]: Delete: no addresses for 26bbd8595197c4b9c12565c06b7239ec8d90f95a1f46973f778ae8ea94553d4a\n","stream":"stderr","time":"2020-12-23T20:30:42.678358033Z"}
{"log":"WARN: 2020/12/23 20:30:42.978469 [allocator]: Delete: no addresses for b888055d05dd792fef86d5e3a78d703e35a46a29835cc1e4a6fb26548830a4c3\n","stream":"stderr","time":"2020-12-23T20:30:42.978783606Z"}
{"log":"WARN: 2020/12/23 20:30:43.007565 [allocator]: Delete: no addresses for 445da6acb5cb9d59adaceabde3ccd0719d6b8f441a00bc076cc25a29523dd59f\n","stream":"stderr","time":"2020-12-23T20:30:43.010962318Z"}
{"log":"WARN: 2020/12/23 20:30:43.035308 [allocator]: Delete: no addresses for 26bbd8595197c4b9c12565c06b7239ec8d90f95a1f46973f778ae8ea94553d4a\n","stream":"stderr","time":"2020-12-23T20:30:43.035508325Z"}
{"log":"WARN: 2020/12/23 20:45:03.474330 [allocator]: Delete: no addresses for c5e1d5b79eb61bced44bc8c6080e6ed4d846d444ba8ae931bb9094d0b57d5e98\n","stream":"stderr","time":"2020-12-23T20:45:03.474652854Z"}


I loved as much as you will receive carried out right here The sketch is attractive your authored material stylish nonetheless you command get got an impatience over that you wish be delivering the following unwell unquestionably come more formerly again since exactly the same nearly a lot often inside case you shield this hike
Wonderful beat I wish to apprentice while you amend your web site how could i subscribe for a blog web site The account aided me a acceptable deal I had been a little bit acquainted of this your broadcast provided bright clear idea
Our Salesforce Salesforce-Data-Cloud practice test is the most reliable solution to quickly prepare for your Salesforce Salesforce Data CloudAccredited Professional Exam (SU24). We are certain that our Salesforce Salesforce-Data-Cloud practice exam will guide you to get certified on the first try. Here is how we serve you to prepare successfully.