Have you ever tried to monitor a docker solution? In this blog post, we will discuss three open source docker monitoring alternatives, before we will go through a step by step guide of a docker monitoring alternative that consist of the components Google cAdvisor as data source, InfluxDB as the database and Grafana for creating the graphs.
The post is built upon a blog post of Brian Christner. However, we will take a shortcut via a docker compose file created by Dale Kate-Murray and Ross Jimenez, which helps us to spin up the needed docker containers within minutes (depending on your Internet speed).
Docker Monitoring Alternatives
Other free docker monitoring solutions are discussed in this youtube video of Brian Christner:
- Google cAdvisor (standalone): easy to use, no config needed
- cAdvisor + InfluxDB + Grafana: flexible, adaptable (the one we will get hands-on experience below)
- Prometheus: all-in-one complete monitoring solution
He is summarizing the capabilities of those solutions like follows:
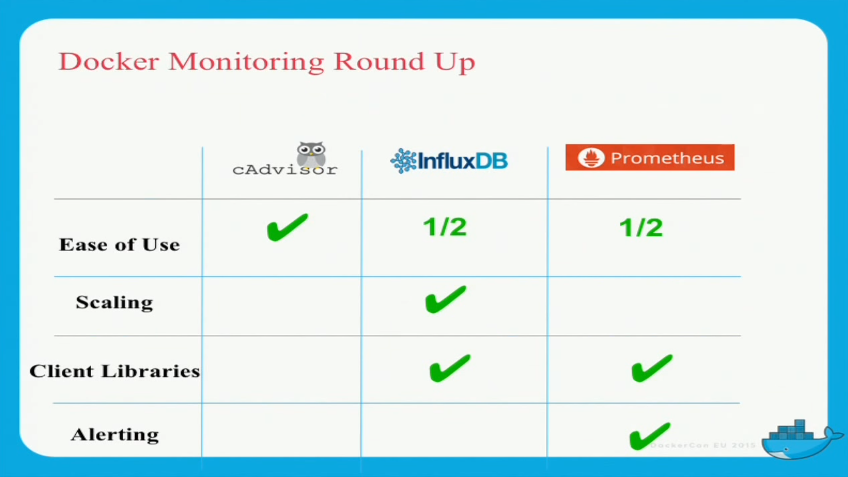
@Brian Christner: I hope it is Okay, that I have copied this slide from your youtube video?
Those are open source alternatives. Brian Christner points out that you might need more complete, enterprise-level solutions than the open source alternatives can offer, e.g. Data Dog (offers a free service for up to five monitored hosts) or Sysdig (the latter also seems to be open source, though). See also this Rancher post, which compares seven docker monitoring alternatives.
Step by Step guide: „Installing“ cAdvisor + InfluxDB + Grafana
Here, we will lead through a step by step guide on how to deploy a flexible docker monitoring solution consisting of Google cAdvisor as data source, InfluxDB as the database and Grafana for creating the graphs. We will make use of a docker compose file Ross Jimenez has created and Brian Christner has included in his git repository
Step 0: Prerequisites
We assume that following prerequisites are met
- Docker is installed. A nice way to install an Ubuntu Docker host via Vagrant is described here (search for the term „Install a Docker Host“).
- You have direct Internet access. If you need to cope with a HTTP proxy, see the official docker instructions, or, if it does not work you may try this blog post.
Step 1: Install docker-compose via Container:
On a Docker host, we will install docker-compose via docker container via following script:
# detect, whether sudo is needed:
sudo echo hallo > /dev/null 2>&1 && SUDO=sudo

# download docker-compose wrapper, if docker-compose:
$SUDO docker-compose --version || \
 $SUDO docker --version && \
 curl -L https://github.com/docker/compose/releases/download/1.8.1/run.sh | $SUDO tee /usr/local/bin/docker-compose && \
 $SUDO chmod +x /usr/local/bin/docker-compose
You might prefer a native installation of docker compose. Please check out the official documentation in this case.
Step 2: Download Docker Compose File
Now we download Brian Christner’s docker monitoring git repository. The CircleCI tests of Brian’s repository are failing currently (as of 2016-10-25), but the software seems to work anyway.
git clone https://github.com/vegasbrianc/docker-monitoring && \
cd docker-monitoring
Step 3: Start Containers
Now let us start the containers via
$ docker-compose up
Starting dockermonitoringrepaired_influxdbData_1
Starting dockermonitoringrepaired_influxdb_1
Starting dockermonitoringrepaired_grafana_1
Starting dockermonitoringrepaired_cadvisor_1
Attaching to dockermonitoringrepaired_influxdbData_1, dockermonitoringrepaired_influxdb_1, dockermonitoringrepaired_cadvisor_1, dockermonitoringrepaired_grafana_1
dockermonitoringrepaired_influxdbData_1 exited with code 0
influxdb_1 | influxdb configuration:
influxdb_1 | ### Welcome to the InfluxDB configuration file.
influxdb_1 |
influxdb_1 | # Once every 24 hours InfluxDB will report anonymous data to m.influxdb.com
influxdb_1 | # The data includes raft id (random 8 bytes), os, arch, version, and metadata.
influxdb_1 | # We don't track ip addresses of servers reporting. This is only used
influxdb_1 | # to track the number of instances running and the versions, which
...
(trunkated; see full log in the Appendix)
...
influxdb_1 | [admin] 2016/10/25 16:48:44 Listening on HTTP: [::]:8083
influxdb_1 | [continuous_querier] 2016/10/25 16:48:44 Starting continuous query service
influxdb_1 | [httpd] 2016/10/25 16:48:44 Starting HTTP service
influxdb_1 | [httpd] 2016/10/25 16:48:44 Authentication enabled: false
influxdb_1 | [httpd] 2016/10/25 16:48:44 Listening on HTTP: [::]:8086
influxdb_1 | [retention] 2016/10/25 16:48:44 Starting retention policy enforcement service with check interval of 30m0s
influxdb_1 | [monitor] 2016/10/25 16:48:44 Storing statistics in database '_internal' retention policy 'monitor', at interval 10s
influxdb_1 | 2016/10/25 16:48:44 Sending anonymous usage statistics to m.influxdb.com
influxdb_1 | [run] 2016/10/25 16:48:44 Listening for signals
Note: if you see a continuous message „Waiting for confirmation of InfluxDB service startup“, you might hit a problem described in an Appendix below. Search for „Waiting for confirmation of InfluxDB service startup“ on this page.
Step 4 (optional): In a different window on the Docker host, we can test the connection like follows:
$ curl --retry 10 --retry-delay 5 -v http://localhost:8083
* Rebuilt URL to: http://localhost:8083/
* Hostname was NOT found in DNS cache
* Trying ::1...
* Connected to localhost (::1) port 8083 (#0)
> GET / HTTP/1.1
> User-Agent: curl/7.35.0
...
</body>

</html>
* Connection #0 to host localhost left intact
Step 5: Connect to cAdvisor, InfluxDB, Grafana
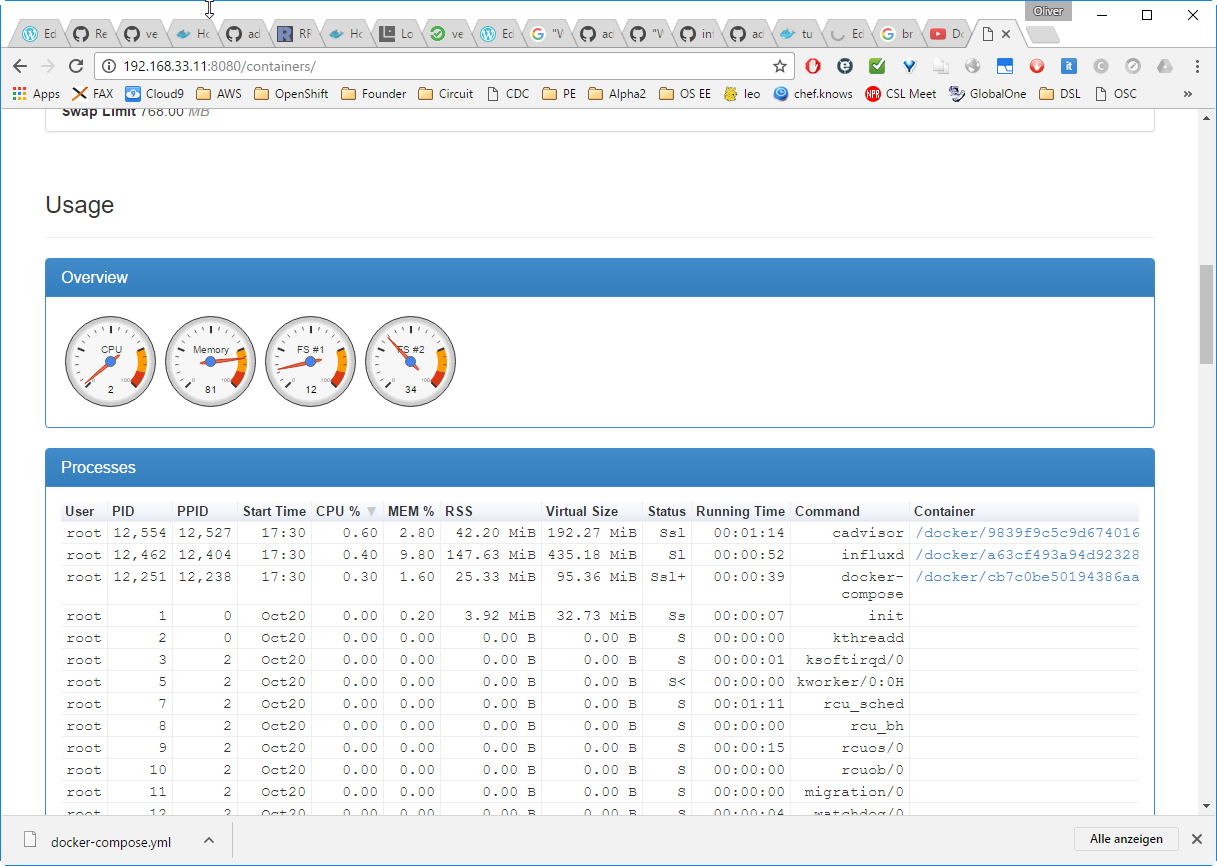
Step 5.1 (optional): Connect to cAdvisor
Now let us connect to cAdvisor. For that, you need to find out, which IP address your docker host is using. In my case, I am using a Vagrant-based Docker host and I have added an additional line
config.vm.network "private_network", ip: "192.168.33.11"
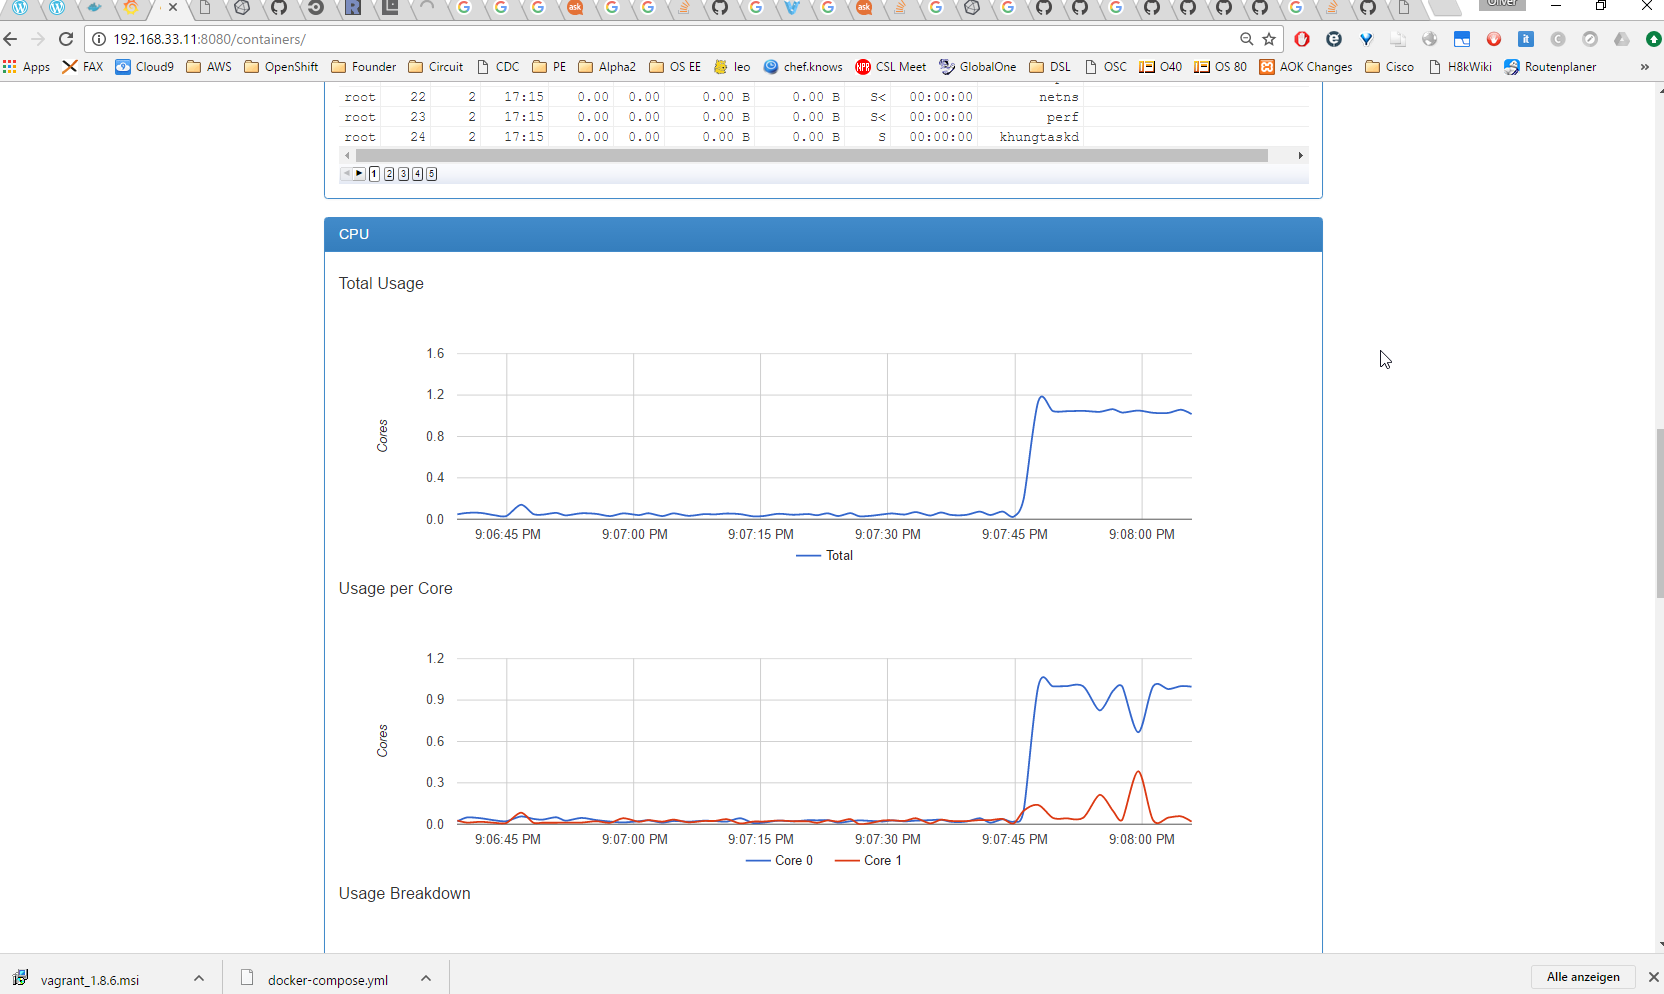
The TCP port can be seen in the docker-compose.yml file: it is 8080. This allows me to connect to cAdvisor‘ dashboard via http://192.168.33.11:8080/containers/:
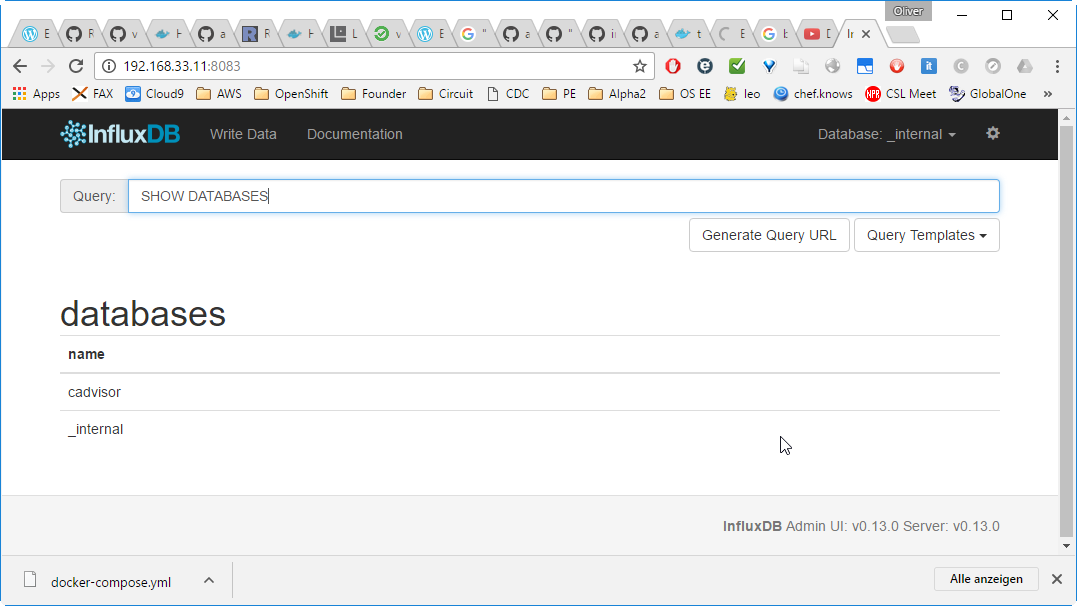
Step 5.2 (optional): connect to InfluxDB
InfluxDB is reachable via http://192.168.33.11:8083/:
Step 5.3 (required): Connect to Grafana
And Grafana can be reached via http://192.168.33.11:3000/: log in as admin with password admin, if you are prompted for it:

Okay, the dashboard is still empty.
Step 6: Add Data Sources to Grafana manually
Connect to Grafana (http://192.168.33.11:3000/ in my case)
Click on Data Sources -> Add new
and add following data:
Name: influxdb
Type: InfluxDB 0.9.x
Note: Be sure to check default box! Otherwise, you will see random data created by Grafana below!
Http settings
Url: http://192.168.33.11:8086 (please adapt the IP address to your environment)
Access: proxy
Basic Auth: Enabled
User: admin
Password: admin
InfluxDB Details
Database: cadvisor
User: root
Password: root
Click Add -> Test Connection (should be successful) -> Save
Step 7: Add New Dashboard to Grafana via json File
Connect to Grafana (http://192.168.33.11:3000/ in my case)
Click on ![]() , then
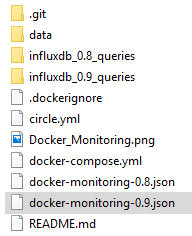
, then ![]() , navigate to the cloned guthub repository, click on the button below Import File and pick the file docker-monitoring-0.9.json:
, navigate to the cloned guthub repository, click on the button below Import File and pick the file docker-monitoring-0.9.json:
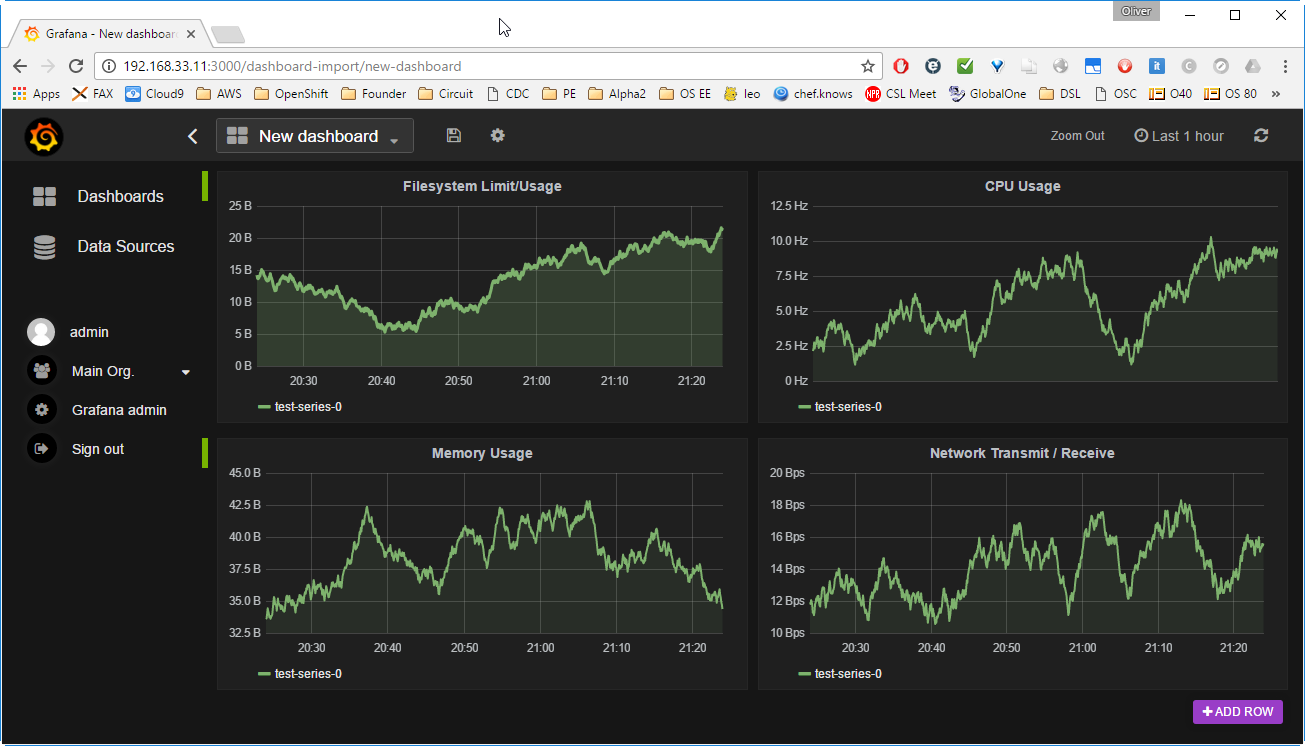
As if by an invisible hand, we get a dashboard with information on Filesystem Usage, CPU Usage, Memory Usage and Network Usage of the Containers on the host.
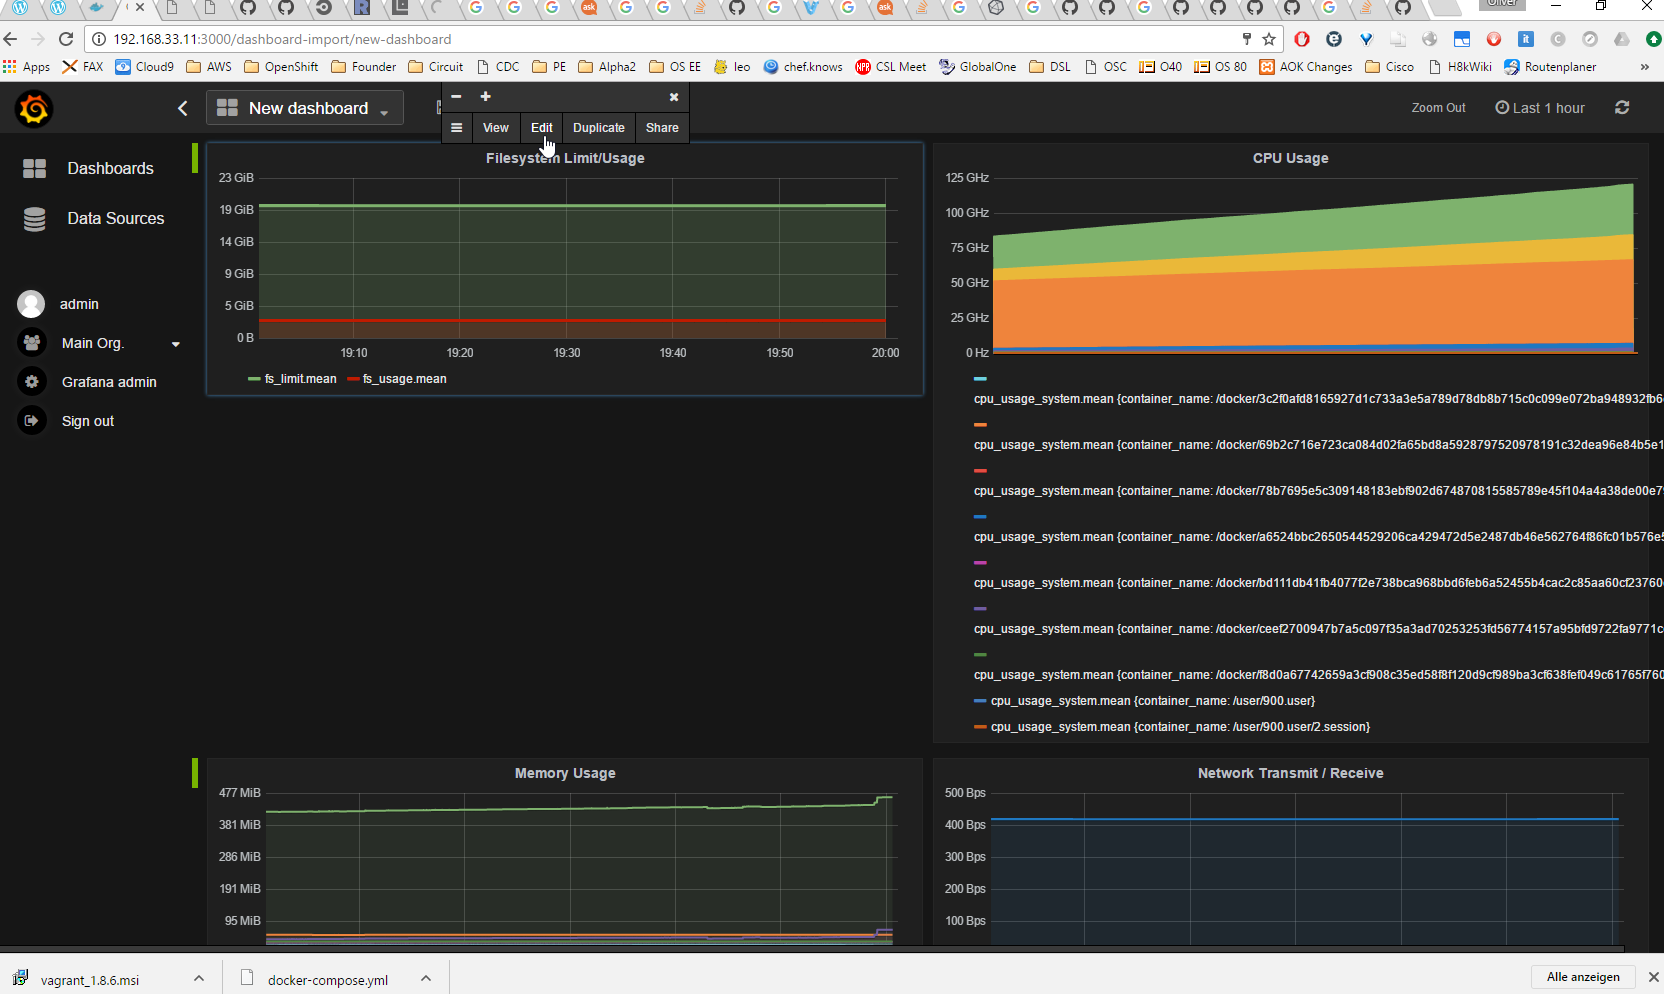
Note: if the graphs look like follows
and the graphs change substantially by clicking
, then you most probably have forgotten to check the „default“ box in step 6. In this case, you need to click on the title of the graph -> Edit -> choose influxdb as data source.
Step 9 (optional): CPU Stress Test
Since only the docker monitoring containers are running, the absolute numbers we see are quite low. Let us start a container that is stressing the CPU a little bit:
docker run -it petarmaric/docker.cpu-stress-test
The graphs of cAdvisor are reacting right away:
Let us wait a few minutes and refresh the Grafana graphs and put our focus on the CPU usage:
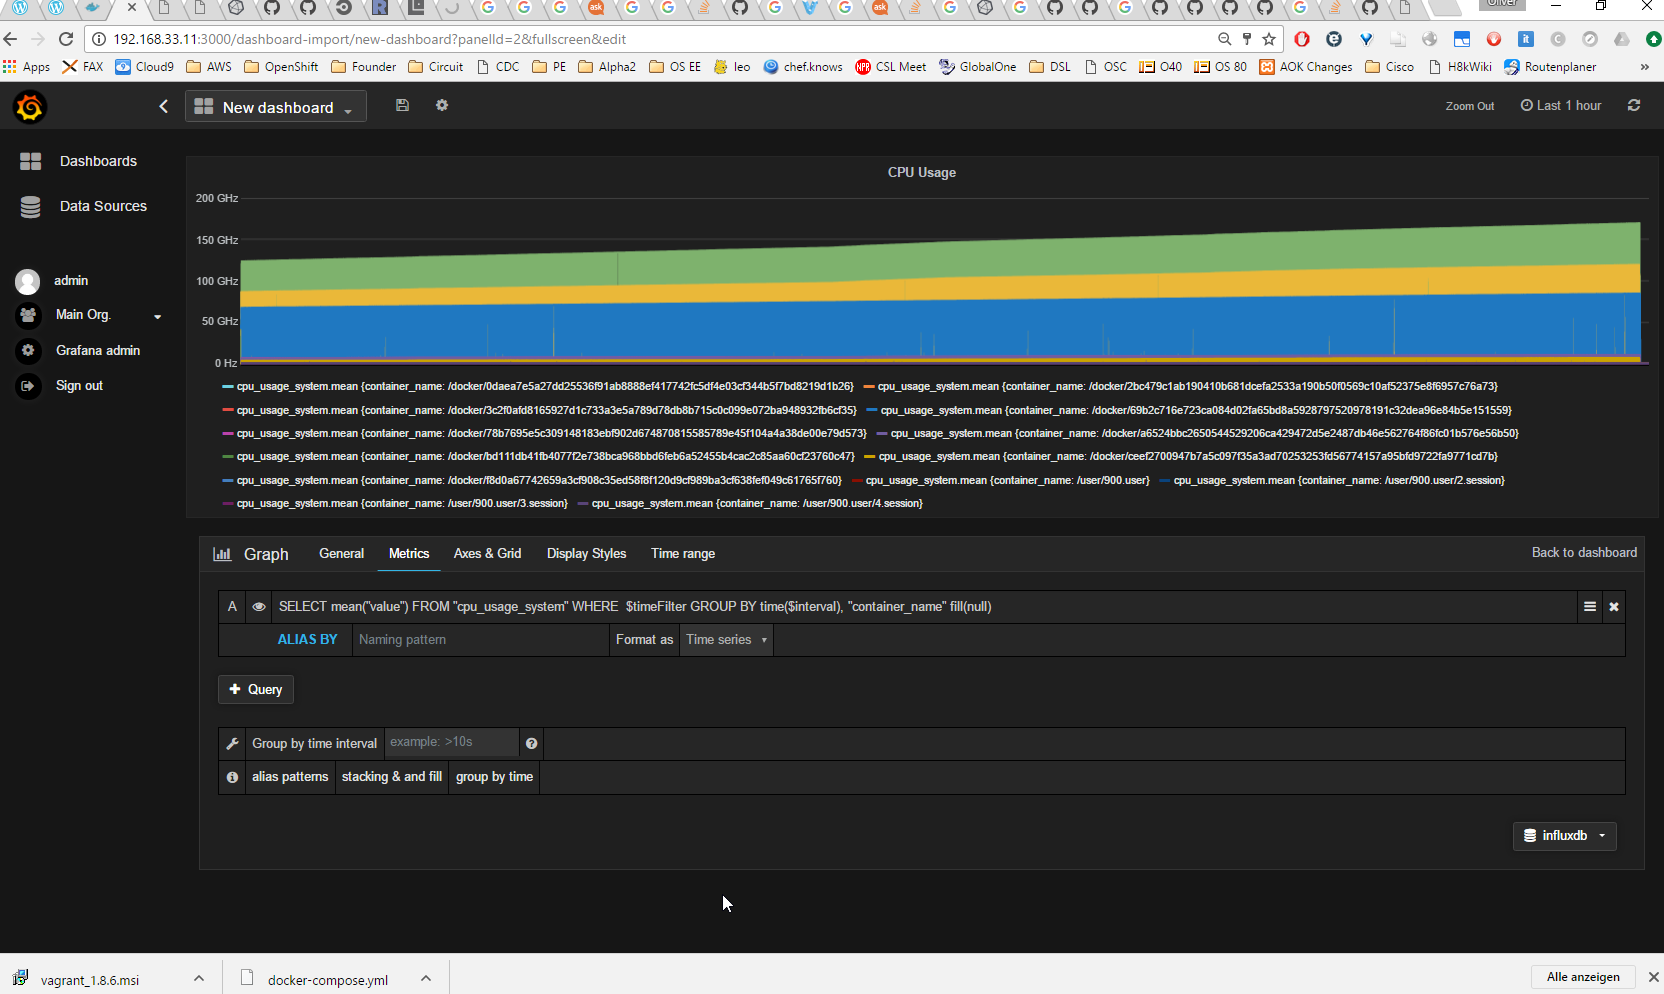
The data does not seem to be reliable. I have opened issue #10 for this. When looking at the InfluxDB data by specifying following URL in a browser:
http://192.168.33.11:8086/query?pretty=true&db=cadvisor&q=SELECT%20%22value%22%20FROM%20%22cpu_usage_system%22
(you need to adapt your IP address), then we get data that is changing by the factor of 10.000 within milliseconds!
{
    "results": [
        {
            "series": [
                {
                    "name": "cpu_usage_system",
                    "columns": [
                        "time",
                        "value"
                    ],
                    "values": [
                        [
                            "2016-10-24T17:12:49.021559212Z",
                            910720000000
                        ],
                        [
                            "2016-10-24T17:12:49.032153994Z",
                            20000000
                        ],
                        [
                            "2016-10-24T17:12:49.033316234Z",
                            5080000000
                        ],
Summary
Following Brian Christner’s youtube video on Docker Monitoring, we have compared three open source Docker monitoring solutions
- Google cAdvisor (standalone): easy to use, no config needed
- cAdvisor + InfluxDB + Grafana: flexible, adaptable (the one we will get hands-on experience below)
- Prometheus: all-in-one complete monitoring solution
By using a pre-defined docker-compose file, solution 2 can be spin up in minutes (unless you are working in a NFS synced Vagrant folder on Windows, which leads to a continuous ‚Waiting for confirmation of InfluxDB service startup‘ message; see the Appendic B below; that problem I have reported here had caused quite a headache on my side).
After the data source is configured manually, a json file helps to create a nice Grafana dashboard within minutes. The dashboard shows graphs about File System Usage, CPU Usage, Memory Usage and Network Usage.
In the moment, there is a ceaveat that the data displayed is not trustworthy. This is investigated in the framework of issue #10 of Brian Christner’s repository. I will report here, when it is resolved.
Next Steps:
- Investigate and resolve the data trustworthiness issue #10.
- Test Prometheus via Brian Christner’s Prometheus Git repository
Appendix A: full startup log of successful ‚docker-compose up‘
$ docker-compose up
Starting dockermonitoringrepaired_influxdbData_1
Starting dockermonitoringrepaired_influxdb_1
Starting dockermonitoringrepaired_grafana_1
Starting dockermonitoringrepaired_cadvisor_1
Attaching to dockermonitoringrepaired_influxdbData_1, dockermonitoringrepaired_influxdb_1, dockermonitoringrepaired_grafana_1, dockermonitoringrepaired_cadvisor_1
dockermonitoringrepaired_influxdbData_1 exited with code 0
influxdb_1 | influxdb configuration:
influxdb_1 | ### Welcome to the InfluxDB configuration file.
influxdb_1 |
influxdb_1 | # Once every 24 hours InfluxDB will report anonymous data to m.influxdb.com
influxdb_1 | # The data includes raft id (random 8 bytes), os, arch, version, and metadata.
influxdb_1 | # We don't track ip addresses of servers reporting. This is only used
influxdb_1 | # to track the number of instances running and the versions, which
influxdb_1 | # is very helpful for us.
influxdb_1 | # Change this option to true to disable reporting.
influxdb_1 | reporting-disabled = false
influxdb_1 |
influxdb_1 | # we'll try to get the hostname automatically, but if it the os returns something
influxdb_1 | # that isn't resolvable by other servers in the cluster, use this option to
influxdb_1 | # manually set the hostname
influxdb_1 | # hostname = "localhost"
influxdb_1 |
influxdb_1 | ###
influxdb_1 | ### [meta]
influxdb_1 | ###
influxdb_1 | ### Controls the parameters for the Raft consensus group that stores metadata
influxdb_1 | ### about the InfluxDB cluster.
influxdb_1 | ###
influxdb_1 |
influxdb_1 | [meta]
influxdb_1 | # Where the metadata/raft database is stored
influxdb_1 | dir = "/data/meta"
influxdb_1 |
influxdb_1 | retention-autocreate = true
influxdb_1 |
influxdb_1 | # If log messages are printed for the meta service
influxdb_1 | logging-enabled = true
influxdb_1 | pprof-enabled = false
influxdb_1 |
influxdb_1 | # The default duration for leases.
influxdb_1 | lease-duration = "1m0s"
influxdb_1 |
influxdb_1 | ###
influxdb_1 | ### [data]
influxdb_1 | ###
influxdb_1 | ### Controls where the actual shard data for InfluxDB lives and how it is
influxdb_1 | ### flushed from the WAL. "dir" may need to be changed to a suitable place
influxdb_1 | ### for your system, but the WAL settings are an advanced configuration. The
influxdb_1 | ### defaults should work for most systems.
influxdb_1 | ###
influxdb_1 |
influxdb_1 | [data]
influxdb_1 | # Controls if this node holds time series data shards in the cluster
influxdb_1 | enabled = true
influxdb_1 |
influxdb_1 | dir = "/data/data"
influxdb_1 |
influxdb_1 | # These are the WAL settings for the storage engine >= 0.9.3
influxdb_1 | wal-dir = "/data/wal"
influxdb_1 | wal-logging-enabled = true
influxdb_1 | data-logging-enabled = true
influxdb_1 |
influxdb_1 | # Whether queries should be logged before execution. Very useful for troubleshooting, but will
influxdb_1 | # log any sensitive data contained within a query.
influxdb_1 | # query-log-enabled = true
influxdb_1 |
influxdb_1 | # Settings for the TSM engine
influxdb_1 |
influxdb_1 | # CacheMaxMemorySize is the maximum size a shard's cache can
influxdb_1 | # reach before it starts rejecting writes.
influxdb_1 | # cache-max-memory-size = 524288000
influxdb_1 |
influxdb_1 | # CacheSnapshotMemorySize is the size at which the engine will
influxdb_1 | # snapshot the cache and write it to a TSM file, freeing up memory
influxdb_1 | # cache-snapshot-memory-size = 26214400
influxdb_1 |
influxdb_1 | # CacheSnapshotWriteColdDuration is the length of time at
influxdb_1 | # which the engine will snapshot the cache and write it to
influxdb_1 | # a new TSM file if the shard hasn't received writes or deletes
influxdb_1 | # cache-snapshot-write-cold-duration = "1h"
influxdb_1 |
influxdb_1 | # MinCompactionFileCount is the minimum number of TSM files
influxdb_1 | # that need to exist before a compaction cycle will run
influxdb_1 | # compact-min-file-count = 3
influxdb_1 |
influxdb_1 | # CompactFullWriteColdDuration is the duration at which the engine
influxdb_1 | # will compact all TSM files in a shard if it hasn't received a
influxdb_1 | # write or delete
influxdb_1 | # compact-full-write-cold-duration = "24h"
influxdb_1 |
influxdb_1 | # MaxPointsPerBlock is the maximum number of points in an encoded
grafana_1 | 2016/10/25 17:30:59 [I] Starting Grafana
grafana_1 | 2016/10/25 17:30:59 [I] Version: 2.6.0, Commit: v2.6.0, Build date: 2015-12-14 14:18:01 +0000 UTC
grafana_1 | 2016/10/25 17:30:59 [I] Configuration Info
grafana_1 | Config files:
grafana_1 | [0]: /usr/share/grafana/conf/defaults.ini
grafana_1 | [1]: /etc/grafana/grafana.ini
grafana_1 | Command lines overrides:
grafana_1 | [0]: default.paths.data=/var/lib/grafana
grafana_1 | [1]: default.paths.logs=/var/log/grafana
grafana_1 | Paths:
grafana_1 | home: /usr/share/grafana
grafana_1 | data: /var/lib/grafana
grafana_1 | logs: /var/log/grafana
grafana_1 |
grafana_1 | 2016/10/25 17:30:59 [I] Database: sqlite3
grafana_1 | 2016/10/25 17:30:59 [I] Migrator: Starting DB migration
grafana_1 | 2016/10/25 17:30:59 [I] Listen: http://0.0.0.0:3000
influxdb_1 | # block in a TSM file. Larger numbers may yield better compression
influxdb_1 | # but could incur a performance penalty when querying
influxdb_1 | # max-points-per-block = 1000
influxdb_1 |
influxdb_1 | ###
influxdb_1 | ### [cluster]
influxdb_1 | ###
influxdb_1 | ### Controls non-Raft cluster behavior, which generally includes how data is
influxdb_1 | ### shared across shards.
influxdb_1 | ###
influxdb_1 |
influxdb_1 | [cluster]
influxdb_1 | shard-writer-timeout = "5s" # The time within which a remote shard must respond to a write request.
influxdb_1 | write-timeout = "10s" # The time within which a write request must complete on the cluster.
influxdb_1 | max-concurrent-queries = 0 # The maximum number of concurrent queries that can run. 0 to disable.
influxdb_1 | query-timeout = "0s" # The time within a query must complete before being killed automatically. 0s to disable.
influxdb_1 | max-select-point = 0 # The maximum number of points to scan in a query. 0 to disable.
influxdb_1 | max-select-series = 0 # The maximum number of series to select in a query. 0 to disable.
influxdb_1 | max-select-buckets = 0 # The maximum number of buckets to select in an aggregate query. 0 to disable.
influxdb_1 |
influxdb_1 | ###
influxdb_1 | ### [retention]
influxdb_1 | ###
influxdb_1 | ### Controls the enforcement of retention policies for evicting old data.
influxdb_1 | ###
influxdb_1 |
influxdb_1 | [retention]
influxdb_1 | enabled = true
influxdb_1 | check-interval = "30m"
influxdb_1 |
influxdb_1 | ###
influxdb_1 | ### [shard-precreation]
influxdb_1 | ###
influxdb_1 | ### Controls the precreation of shards, so they are available before data arrives.
influxdb_1 | ### Only shards that, after creation, will have both a start- and end-time in the
influxdb_1 | ### future, will ever be created. Shards are never precreated that would be wholly
influxdb_1 | ### or partially in the past.
influxdb_1 |
influxdb_1 | [shard-precreation]
influxdb_1 | enabled = true
influxdb_1 | check-interval = "10m"
influxdb_1 | advance-period = "30m"
influxdb_1 |
influxdb_1 | ###
influxdb_1 | ### Controls the system self-monitoring, statistics and diagnostics.
influxdb_1 | ###
influxdb_1 | ### The internal database for monitoring data is created automatically if
influxdb_1 | ### if it does not already exist. The target retention within this database
influxdb_1 | ### is called 'monitor' and is also created with a retention period of 7 days
influxdb_1 | ### and a replication factor of 1, if it does not exist. In all cases the
influxdb_1 | ### this retention policy is configured as the default for the database.
influxdb_1 |
influxdb_1 | [monitor]
influxdb_1 | store-enabled = true # Whether to record statistics internally.
influxdb_1 | store-database = "_internal" # The destination database for recorded statistics
influxdb_1 | store-interval = "10s" # The interval at which to record statistics
influxdb_1 |
influxdb_1 | ###
influxdb_1 | ### [admin]
influxdb_1 | ###
influxdb_1 | ### Controls the availability of the built-in, web-based admin interface. If HTTPS is
influxdb_1 | ### enabled for the admin interface, HTTPS must also be enabled on the [http] service.
influxdb_1 | ###
influxdb_1 |
influxdb_1 | [admin]
influxdb_1 | enabled = true
influxdb_1 | bind-address = ":8083"
influxdb_1 | https-enabled = false
influxdb_1 | https-certificate = "/etc/ssl/influxdb.pem"
influxdb_1 |
influxdb_1 | ###
influxdb_1 | ### [http]
influxdb_1 | ###
influxdb_1 | ### Controls how the HTTP endpoints are configured. These are the primary
influxdb_1 | ### mechanism for getting data into and out of InfluxDB.
influxdb_1 | ###
influxdb_1 |
influxdb_1 | [http]
influxdb_1 | enabled = true
influxdb_1 | bind-address = ":8086"
influxdb_1 | auth-enabled = false
influxdb_1 | log-enabled = true
influxdb_1 | write-tracing = false
influxdb_1 | pprof-enabled = false
influxdb_1 | https-enabled = false
influxdb_1 | https-certificate = "/etc/ssl/influxdb.pem"
influxdb_1 | max-row-limit = 10000
influxdb_1 |
influxdb_1 | ###
influxdb_1 | ### [[graphite]]
influxdb_1 | ###
influxdb_1 | ### Controls one or many listeners for Graphite data.
influxdb_1 | ###
influxdb_1 |
influxdb_1 | [[graphite]]
influxdb_1 | enabled = false
influxdb_1 | database = "graphitedb"
influxdb_1 | bind-address = ":2003"
influxdb_1 | protocol = "tcp"
influxdb_1 | # consistency-level = "one"
influxdb_1 |
influxdb_1 | # These next lines control how batching works. You should have this enabled
influxdb_1 | # otherwise you could get dropped metrics or poor performance. Batching
influxdb_1 | # will buffer points in memory if you have many coming in.
influxdb_1 |
influxdb_1 | # batch-size = 5000 # will flush if this many points get buffered
influxdb_1 | # batch-pending = 10 # number of batches that may be pending in memory
influxdb_1 | # batch-timeout = "1s" # will flush at least this often even if we haven't hit buffer limit
influxdb_1 | # udp-read-buffer = 0 # UDP Read buffer size, 0 means OS default. UDP listener will fail if set above OS max.
influxdb_1 |
influxdb_1 | ### This string joins multiple matching 'measurement' values providing more control over the final measurement name.
influxdb_1 | # separator = "."
influxdb_1 |
influxdb_1 | ### Default tags that will be added to all metrics. These can be overridden at the template level
influxdb_1 | ### or by tags extracted from metric
influxdb_1 | # tags = ["region=us-east", "zone=1c"]
influxdb_1 |
influxdb_1 | ### Each template line requires a template pattern. It can have an optional
influxdb_1 | ### filter before the template and separated by spaces. It can also have optional extra
influxdb_1 | ### tags following the template. Multiple tags should be separated by commas and no spaces
influxdb_1 | ### similar to the line protocol format. There can be only one default template.
influxdb_1 | templates = [
influxdb_1 | # filter + template
influxdb_1 | #"*.app env.service.resource.measurement",
influxdb_1 | # filter + template + extra tag
influxdb_1 | #"stats.* .host.measurement* region=us-west,agent=sensu",
influxdb_1 | # default template. Ignore the first graphite component "servers"
influxdb_1 | "instance.profile.measurement*"
influxdb_1 | ]
influxdb_1 |
influxdb_1 | ###
influxdb_1 | ### [collectd]
influxdb_1 | ###
influxdb_1 | ### Controls one or many listeners for collectd data.
influxdb_1 | ###
influxdb_1 |
influxdb_1 | [[collectd]]
influxdb_1 | enabled = false
influxdb_1 | # bind-address = ":25826"
influxdb_1 | # database = "collectd"
influxdb_1 | # typesdb = "/usr/share/collectd/types.db"
influxdb_1 | # retention-policy = ""
influxdb_1 |
influxdb_1 | # These next lines control how batching works. You should have this enabled
influxdb_1 | # otherwise you could get dropped metrics or poor performance. Batching
influxdb_1 | # will buffer points in memory if you have many coming in.
influxdb_1 |
influxdb_1 | # batch-size = 1000 # will flush if this many points get buffered
influxdb_1 | # batch-pending = 5 # number of batches that may be pending in memory
influxdb_1 | # batch-timeout = "1s" # will flush at least this often even if we haven't hit buffer limit
influxdb_1 | # read-buffer = 0 # UDP Read buffer size, 0 means OS default. UDP listener will fail if set above OS max.
influxdb_1 |
influxdb_1 | ###
influxdb_1 | ### [opentsdb]
influxdb_1 | ###
influxdb_1 | ### Controls one or many listeners for OpenTSDB data.
influxdb_1 | ###
influxdb_1 |
influxdb_1 | [[opentsdb]]
influxdb_1 | enabled = false
influxdb_1 | # bind-address = ":4242"
influxdb_1 | # database = "opentsdb"
influxdb_1 | # retention-policy = ""
influxdb_1 | # consistency-level = "one"
influxdb_1 | # tls-enabled = false
influxdb_1 | # certificate= ""
influxdb_1 | # log-point-errors = true # Log an error for every malformed point.
influxdb_1 |
influxdb_1 | # These next lines control how batching works. You should have this enabled
influxdb_1 | # otherwise you could get dropped metrics or poor performance. Only points
influxdb_1 | # metrics received over the telnet protocol undergo batching.
influxdb_1 |
influxdb_1 | # batch-size = 1000 # will flush if this many points get buffered
cadvisor_1 | I1025 17:30:59.170040 1 storagedriver.go:42] Using backend storage type "influxdb"
cadvisor_1 | I1025 17:30:59.170881 1 storagedriver.go:44] Caching stats in memory for 2m0s
cadvisor_1 | I1025 17:30:59.171032 1 manager.go:131] cAdvisor running in container: "/docker/9839f9c5c9d674016006e4d4144f984ea91320686356235951f21f0b51306c47"
cadvisor_1 | I1025 17:30:59.194143 1 fs.go:107] Filesystem partitions: map[/dev/dm-0:{mountpoint:/rootfs major:252 minor:0 fsType: blockSize:0} /dev/sda1:{mountpoint:/rootfs/boot major:8 minor:1 fsType: blockSize:0}]
influxdb_1 | # batch-pending = 5 # number of batches that may be pending in memory
influxdb_1 | # batch-timeout = "1s" # will flush at least this often even if we haven't hit buffer limit
influxdb_1 |
influxdb_1 | ###
influxdb_1 | ### [[udp]]
influxdb_1 | ###
influxdb_1 | ### Controls the listeners for InfluxDB line protocol data via UDP.
influxdb_1 | ###
influxdb_1 |
influxdb_1 | [[udp]]
influxdb_1 | enabled = false
influxdb_1 | bind-address = ":4444"
influxdb_1 | database = "udpdb"
influxdb_1 | # retention-policy = ""
influxdb_1 |
influxdb_1 | # These next lines control how batching works. You should have this enabled
influxdb_1 | # otherwise you could get dropped metrics or poor performance. Batching
influxdb_1 | # will buffer points in memory if you have many coming in.
influxdb_1 |
influxdb_1 | # batch-size = 1000 # will flush if this many points get buffered
influxdb_1 | # batch-pending = 5 # number of batches that may be pending in memory
influxdb_1 | # batch-timeout = "1s" # will flush at least this often even if we haven't hit buffer limit
influxdb_1 | # read-buffer = 0 # UDP Read buffer size, 0 means OS default. UDP listener will fail if set above OS max.
influxdb_1 |
influxdb_1 | # set the expected UDP payload size; lower values tend to yield better performance, default is max UDP size 65536
influxdb_1 | # udp-payload-size = 65536
influxdb_1 |
influxdb_1 | ###
influxdb_1 | ### [continuous_queries]
influxdb_1 | ###
influxdb_1 | ### Controls how continuous queries are run within InfluxDB.
influxdb_1 | ###
influxdb_1 |
influxdb_1 | [continuous_queries]
influxdb_1 | log-enabled = true
influxdb_1 | enabled = true
influxdb_1 | # run-interval = "1s" # interval for how often continuous queries will be checked if they need to run=> Starting InfluxDB ...
influxdb_1 | => About to create the following database: cadvisor
influxdb_1 | => Database had been created before, skipping ...
influxdb_1 | exec influxd -config=${CONFIG_FILE}
influxdb_1 |
influxdb_1 | 8888888 .d888 888 8888888b. 888888b.
influxdb_1 | 888 d88P" 888 888 "Y88b 888 "88b
influxdb_1 | 888 888 888 888 888 888 .88P
influxdb_1 | 888 88888b. 888888 888 888 888 888 888 888 888 8888888K.
influxdb_1 | 888 888 "88b 888 888 888 888 Y8bd8P' 888 888 888 "Y88b
influxdb_1 | 888 888 888 888 888 888 888 X88K 888 888 888 888
influxdb_1 | 888 888 888 888 888 Y88b 888 .d8""8b. 888 .d88P 888 d88P
influxdb_1 | 8888888 888 888 888 888 "Y88888 888 888 8888888P" 8888888P"
influxdb_1 |
cadvisor_1 | I1025 17:30:59.228909 1 machine.go:50] Couldn't collect info from any of the files in "/rootfs/etc/machine-id,/var/lib/dbus/machine-id"
cadvisor_1 | I1025 17:30:59.229080 1 manager.go:166] Machine: {NumCores:2 CpuFrequency:2592000 MemoryCapacity:1569599488 MachineID: SystemUUID:B63CB367-870F-4E48-917F-7E524C2C67A0 BootID:e225b37a-b8e6-466b-9f67-84b74df8e90c Filesystems:[{Device:/dev/dm-0 Capacity:41092214784} {Device:/dev/sda1 Capacity:246755328}] DiskMap:map[252:0:{Name:dm-0 Major:252 Minor:0 Size:41884319744 Scheduler:none} 252:1:{Name:dm-1 Major:252 Minor:1 Size:805306368 Scheduler:none} 8:0:{Name:sda Major:8 Minor:0 Size:42949672960 Scheduler:deadline}] NetworkDevices:[{Name:br-067c518abd1f MacAddress:02:42:78:41:c0:71 Speed:0 Mtu:1500} {Name:br-1c136984ac6d MacAddress:02:42:0c:dc:89:ac Speed:0 Mtu:1500} {Name:br-9b7560132352 MacAddress:02:42:5c:df:9a:43 Speed:0 Mtu:1500} {Name:eth0 MacAddress:08:00:27:c7:ba:b5 Speed:1000 Mtu:1500} {Name:eth1 MacAddress:08:00:27:51:9c:7e Speed:1000 Mtu:1500}] Topology:[{Id:0 Memory:1569599488 Cores:[{Id:0 Threads:[0] Caches:[{Size:32768 Type:Data Level:1} {Size:32768 Type:Instruction Level:1} {Size:262144 Type:Unified Level:2} {Size:6291456 Type:Unified Level:3}]} {Id:1 Threads:[1] Caches:[{Size:32768 Type:Data Level:1} {Size:32768 Type:Instruction Level:1} {Size:262144 Type:Unified Level:2} {Size:6291456 Type:Unified Level:3}]}] Caches:[]}] CloudProvider:Unknown InstanceType:Unknown}
cadvisor_1 | I1025 17:30:59.229884 1 manager.go:172] Version: {KernelVersion:4.2.0-42-generic ContainerOsVersion:Alpine Linux v3.2 DockerVersion:1.12.1 CadvisorVersion:0.20.5 CadvisorRevision:9aa348f}
influxdb_1 | [run] 2016/10/25 17:30:58 InfluxDB starting, version 0.13.0, branch 0.13, commit e57fb88a051ee40fd9277094345fbd47bb4783ce
influxdb_1 | [run] 2016/10/25 17:30:58 Go version go1.6.2, GOMAXPROCS set to 2
influxdb_1 | [run] 2016/10/25 17:30:58 Using configuration at: /config/config.toml
influxdb_1 | [store] 2016/10/25 17:30:58 Using data dir: /data/data
influxdb_1 | [tsm1wal] 2016/10/25 17:30:58 tsm1 WAL starting with 10485760 segment size
influxdb_1 | [tsm1wal] 2016/10/25 17:30:58 tsm1 WAL writing to /data/wal/_internal/monitor/1
influxdb_1 | [tsm1wal] 2016/10/25 17:30:58 tsm1 WAL starting with 10485760 segment size
influxdb_1 | [tsm1wal] 2016/10/25 17:30:58 tsm1 WAL writing to /data/wal/cadvisor/default/2
influxdb_1 | [filestore] 2016/10/25 17:30:58 /data/data/_internal/monitor/1/000000001-000000001.tsm (#0) opened in 1.243404ms
influxdb_1 | [cacheloader] 2016/10/25 17:30:58 reading file /data/wal/_internal/monitor/1/_00001.wal, size 1777379
influxdb_1 | [filestore] 2016/10/25 17:30:58 /data/data/cadvisor/default/2/000000001-000000001.tsm (#0) opened in 1.725916ms
influxdb_1 | [cacheloader] 2016/10/25 17:30:58 reading file /data/wal/cadvisor/default/2/_00001.wal, size 4130244
influxdb_1 | [tsm1wal] 2016/10/25 17:30:58 tsm1 WAL starting with 10485760 segment size
influxdb_1 | [tsm1wal] 2016/10/25 17:30:58 tsm1 WAL writing to /data/wal/_internal/monitor/3
influxdb_1 | [cacheloader] 2016/10/25 17:30:58 reading file /data/wal/_internal/monitor/3/_00001.wal, size 1097258
cadvisor_1 | E1025 17:30:59.248299 1 manager.go:208] Docker container factory registration failed: docker found, but not using native exec driver.
cadvisor_1 | I1025 17:30:59.262682 1 factory.go:94] Registering Raw factory
cadvisor_1 | I1025 17:30:59.327660 1 manager.go:1000] Started watching for new ooms in manager
cadvisor_1 | W1025 17:30:59.327883 1 manager.go:239] Could not configure a source for OOM detection, disabling OOM events: exec: "journalctl": executable file not found in $PATH
cadvisor_1 | I1025 17:30:59.328250 1 manager.go:252] Starting recovery of all containers
cadvisor_1 | I1025 17:30:59.371456 1 manager.go:257] Recovery completed
cadvisor_1 | I1025 17:30:59.395792 1 cadvisor.go:106] Starting cAdvisor version: 0.20.5-9aa348f on port 8080
influxdb_1 | [cacheloader] 2016/10/25 17:30:59 reading file /data/wal/cadvisor/default/2/_00002.wal, size 2232957
influxdb_1 | [cacheloader] 2016/10/25 17:30:59 reading file /data/wal/_internal/monitor/3/_00002.wal, size 197651
influxdb_1 | [cacheloader] 2016/10/25 17:30:59 reading file /data/wal/_internal/monitor/3/_00003.wal, size 0
influxdb_1 | [shard] 2016/10/25 17:30:59 /data/data/_internal/monitor/3 database index loaded in 1.387775ms
influxdb_1 | [store] 2016/10/25 17:30:59 /data/data/_internal/monitor/3 opened in 865.976354ms
influxdb_1 | [cacheloader] 2016/10/25 17:30:59 reading file /data/wal/_internal/monitor/1/_00004.wal, size 0
influxdb_1 | [shard] 2016/10/25 17:30:59 /data/data/_internal/monitor/1 database index loaded in 3.29894ms
influxdb_1 | [store] 2016/10/25 17:30:59 /data/data/_internal/monitor/1 opened in 896.765569ms
influxdb_1 | [cacheloader] 2016/10/25 17:30:59 reading file /data/wal/cadvisor/default/2/_00003.wal, size 444696
influxdb_1 | [cacheloader] 2016/10/25 17:30:59 reading file /data/wal/cadvisor/default/2/_00004.wal, size 0
influxdb_1 | [shard] 2016/10/25 17:30:59 /data/data/cadvisor/default/2 database index loaded in 2.465579ms
influxdb_1 | [store] 2016/10/25 17:30:59 /data/data/cadvisor/default/2 opened in 981.523781ms
influxdb_1 | [subscriber] 2016/10/25 17:30:59 opened service
influxdb_1 | [monitor] 2016/10/25 17:30:59 Starting monitor system
influxdb_1 | [monitor] 2016/10/25 17:30:59 'build' registered for diagnostics monitoring
influxdb_1 | [monitor] 2016/10/25 17:30:59 'runtime' registered for diagnostics monitoring
influxdb_1 | [monitor] 2016/10/25 17:30:59 'network' registered for diagnostics monitoring
influxdb_1 | [monitor] 2016/10/25 17:30:59 'system' registered for diagnostics monitoring
influxdb_1 | [cluster] 2016/10/25 17:30:59 Starting cluster service
influxdb_1 | [shard-precreation] 2016/10/25 17:30:59 Starting precreation service with check interval of 10m0s, advance period of 30m0s
influxdb_1 | [snapshot] 2016/10/25 17:30:59 Starting snapshot service
influxdb_1 | [copier] 2016/10/25 17:30:59 Starting copier service
influxdb_1 | [admin] 2016/10/25 17:30:59 Starting admin service
influxdb_1 | [admin] 2016/10/25 17:30:59 Listening on HTTP: [::]:8083
influxdb_1 | [continuous_querier] 2016/10/25 17:30:59 Starting continuous query service
influxdb_1 | [httpd] 2016/10/25 17:30:59 Starting HTTP service
influxdb_1 | [httpd] 2016/10/25 17:30:59 Authentication enabled: false
influxdb_1 | [httpd] 2016/10/25 17:30:59 Listening on HTTP: [::]:8086
influxdb_1 | [retention] 2016/10/25 17:30:59 Starting retention policy enforcement service with check interval of 30m0s
influxdb_1 | [run] 2016/10/25 17:30:59 Listening for signals
influxdb_1 | [monitor] 2016/10/25 17:30:59 Storing statistics in database '_internal' retention policy 'monitor', at interval 10s
influxdb_1 | 2016/10/25 17:30:59 Sending anonymous usage statistics to m.influxdb.com
Appendix: Error message “
Appendix B: ‚Waiting for confirmation of InfluxDB service startup‘
After issuing the command
docker-compose up
I had hit a problem described here, that was caused by using a Vagrant synced folder as working directory.
vagrant@openshift-installer /vagrant/Monitoring/docker-monitoring_master $ docker-compose up
Starting dockermonitoringmaster_influxdbData_1
Starting dockermonitoringmaster_influxdb_1
Starting dockermonitoringmaster_cadvisor_1
Starting dockermonitoringmaster_grafana_1
Attaching to dockermonitoringmaster_influxdbData_1, dockermonitoringmaster_influxdb_1, dockermonitoringmaster_grafana_1, dockermonitoringmaster_cadvisor_1
dockermonitoringmaster_influxdbData_1 exited with code 0
influxdb_1      | => Starting InfluxDB in background ...
influxdb_1      | => Waiting for confirmation of InfluxDB service startup ...
influxdb_1      |
influxdb_1      |  8888888           .d888 888                   8888888b.  888888b.
influxdb_1      |    888            d88P"  888                   888  "Y88b 888  "88b
influxdb_1      |    888            888    888                   888    888 888  .88P
influxdb_1      |    888   88888b.  888888 888 888  888 888  888 888    888 8888888K.
influxdb_1      |    888   888 "88b 888    888 888  888  Y8bd8P' 888    888 888  "Y88b
influxdb_1      |    888   888  888 888    888 888  888   X88K   888    888 888    888
influxdb_1      |    888   888  888 888    888 Y88b 888 .d8""8b. 888  .d88P 888   d88P
influxdb_1      |  8888888 888  888 888    888  "Y88888 888  888 8888888P"  8888888P"
influxdb_1      |
influxdb_1      | 2016/10/28 12:34:49 InfluxDB starting, version 0.9.6.1, branch 0.9.6, commit 6d3a8603cfdaf1a141779ed88b093dcc5c528e5e, built 2015-12-10T23:40:23+0000
influxdb_1      | 2016/10/28 12:34:49 Go version go1.4.2, GOMAXPROCS set to 2
influxdb_1      | 2016/10/28 12:34:49 Using configuration at: /config/config.toml
influxdb_1      | [metastore] 2016/10/28 12:34:49 Using data dir: /data/meta
influxdb_1      | [retention] 2016/10/28 12:34:49 retention policy enforcement terminating
influxdb_1      | [monitor] 2016/10/28 12:34:49 shutting down monitor system
influxdb_1      | [handoff] 2016/10/28 12:34:49 shutting down hh service
influxdb_1      | [subscriber] 2016/10/28 12:34:49 closed service
influxdb_1      | run: open server: open meta store: raft: new bolt store: invalid argument
grafana_1       | 2016/10/28 12:34:50 [I] Starting Grafana
grafana_1       | 2016/10/28 12:34:50 [I] Version: 2.6.0, Commit: v2.6.0, Build date: 2015-12-14 14:18:01 +0000 UTC
grafana_1       | 2016/10/28 12:34:50 [I] Configuration Info
grafana_1       | Config files:
grafana_1       |   [0]: /usr/share/grafana/conf/defaults.ini
grafana_1       |   [1]: /etc/grafana/grafana.ini
grafana_1       | Command lines overrides:
grafana_1       |   [0]: default.paths.data=/var/lib/grafana
grafana_1       |   [1]: default.paths.logs=/var/log/grafana
grafana_1       | Paths:
grafana_1       |   home: /usr/share/grafana
grafana_1       |   data: /var/lib/grafana
grafana_1       |   logs: /var/log/grafana
grafana_1       |
grafana_1       | 2016/10/28 12:34:50 [I] Database: sqlite3
grafana_1       | 2016/10/28 12:34:50 [I] Migrator: Starting DB migration
grafana_1       | 2016/10/28 12:34:50 [I] Listen: http://0.0.0.0:3000
cadvisor_1      | I1028 12:34:50.214917       1 storagedriver.go:42] Using backend storage type "influxdb"
cadvisor_1      | I1028 12:34:50.215243       1 storagedriver.go:44] Caching stats in memory for 2m0s
cadvisor_1      | I1028 12:34:50.215376       1 manager.go:131] cAdvisor running in container: "/docker/2da85f53aaf23024eb2016dc330b05634972252eea2f230831e3676ad3b6fa73"
cadvisor_1      | I1028 12:34:50.238721       1 fs.go:107] Filesystem partitions: map[/dev/dm-0:{mountpoint:/rootfs major:252 minor:0 fsType: blockSize:0} /dev/sda1:{mountpoint:/rootfs/boot major:8 minor:1 fsType: blockSize:0}]
cadvisor_1      | I1028 12:34:50.249690       1 machine.go:50] Couldn't collect info from any of the files in "/rootfs/etc/machine-id,/var/lib/dbus/machine-id"
cadvisor_1      | I1028 12:34:50.249806       1 manager.go:166] Machine: {NumCores:2 CpuFrequency:2592000 MemoryCapacity:1569599488 MachineID: SystemUUID:B63CB367-870F-4E48-917F-7E524C2C67A0 BootID:e225b37a-b8e6-466b-9f67-84b74df8e90c Filesystems:[{Device:/dev/dm-0 Capacity:41092214784} {Device:/dev/sda1 Capacity:246755328}] DiskMap:map[252:0:{Name:dm-0 Major:252 Minor:0 Size:41884319744 Scheduler:none} 252:1:{Name:dm-1 Major:252 Minor:1 Size:805306368 Scheduler:none} 8:0:{Name:sda Major:8 Minor:0 Size:42949672960 Scheduler:deadline}] NetworkDevices:[{Name:br-067c518abd1f MacAddress:02:42:78:41:c0:71 Speed:0 Mtu:1500} {Name:br-1c136984ac6d MacAddress:02:42:0c:dc:89:ac Speed:0 Mtu:1500} {Name:br-3b100a8c826a MacAddress:02:42:11:2c:a0:4c Speed:0 Mtu:1500} {Name:br-5573a4076799 MacAddress:02:42:97:14:9a:fc Speed:0 Mtu:1500} {Name:br-9b7560132352 MacAddress:02:42:5c:df:9a:43 Speed:0 Mtu:1500} {Name:eth0 MacAddress:08:00:27:c7:ba:b5 Speed:1000 Mtu:1500} {Name:eth1 MacAddress:08:00:27:51:9c:7e Speed:1000 Mtu:1500}] Topology:[{Id:0 Memory:1569599488 Cores:[{Id:0 Threads:[0] Caches:[{Size:32768 Type:Data Level:1} {Size:32768 Type:Instruction Level:1} {Size:262144 Type:Unified Level:2} {Size:6291456 Type:Unified Level:3}]} {Id:1 Threads:[1] Caches:[{Size:32768 Type:Data Level:1} {Size:32768 Type:Instruction Level:1} {Size:262144 Type:Unified Level:2} {Size:6291456 Type:Unified Level:3}]}] Caches:[]}] CloudProvider:Unknown InstanceType:Unknown}
cadvisor_1      | I1028 12:34:50.251115       1 manager.go:172] Version: {KernelVersion:4.2.0-42-generic ContainerOsVersion:Alpine Linux v3.2 DockerVersion:1.12.1 CadvisorVersion:0.20.5 CadvisorRevision:9aa348f}
cadvisor_1      | E1028 12:34:50.273526       1 manager.go:208] Docker container factory registration failed: docker found, but not using native exec driver.
cadvisor_1      | I1028 12:34:50.279684       1 factory.go:94] Registering Raw factory
cadvisor_1      | I1028 12:34:50.316816       1 manager.go:1000] Started watching for new ooms in manager
cadvisor_1      | W1028 12:34:50.316960       1 manager.go:239] Could not configure a source for OOM detection, disabling OOM events: exec: "journalctl": executable file not found in $PATH
cadvisor_1      | I1028 12:34:50.317927       1 manager.go:252] Starting recovery of all containers
cadvisor_1      | I1028 12:34:50.336674       1 manager.go:257] Recovery completed
cadvisor_1      | I1028 12:34:50.352618       1 cadvisor.go:106] Starting cAdvisor version: 0.20.5-9aa348f on port 8080
influxdb_1      | => Waiting for confirmation of InfluxDB service startup ...
influxdb_1      | => Waiting for confirmation of InfluxDB service startup ...
influxdb_1      | => Waiting for confirmation of InfluxDB service startup ...
influxdb_1      | => Waiting for confirmation of InfluxDB service startup ...
To confirm the issue, you can try to connect to port 8083 in a different window on the docker host:
(docker host) $ curl --retry 10 --retry-delay 5 -v http://localhost:8083
* Rebuilt URL to: http://localhost:8083/
* Hostname was NOT found in DNS cache
*   Trying ::1...
* Connected to localhost (::1) port 8083 (#0)
> GET / HTTP/1.1
> User-Agent: curl/7.35.0
> Host: localhost:8083
> Accept: */*
>
* Recv failure: Connection reset by peer
* Closing connection 0
curl: (56) Recv failure: Connection reset by peer
I.e. there is a TCP RST on the port.
Reason:
The reason of this problem lies in a problem with Vagrant synced folders of type „vboxsf“.
Workaround 1a: do not use synced folders
The problem disappears, if you clone the repository into a non-synced folder.
Workaround 1b: use synced folders of different type
The problem disappears, if you use a synced folder of different type. I have tested to use Vagrant synched folder of type „smb“.
- add the line
config.vm.synced_folder ".", "/vagrant", type: "smb"
to the Vagrantfile inside the configure section
- start CMD as Administrator. E.g. run
runas.exe /savecred /user:Administrator "cmd"
in a non-priviledged CMD
- run
vagrant up
in the privideged CMD session.
After that, you can ssh into the docker host system, and clone the repository and run docker-compose up like starting in step 1 without hitting the InfluxDB problem.
Workaround 2: upgrade InfluxDB to 0.13
The problem disappears even, if we use vboxfs synced folders, if we update InfluxDN to 0.13:
I have found this InfluxDB 0.9 issue with the same symptoms. This is, why I have tried to upgrade, still working within the Vagrant synced folder /vagrant.
Step 1: Upgrade InfluxDB
In the docker-compose.yml file replace
influxdb:
 image: tutum/influxdb:0.9
by
influxdb:
 image: tutum/influxdb:0.13
Step 2: remove ./data folder (important! Otherwise, the problem will persist!)
Step 3: Try again:
$ docker-compose up
Starting dockermonitoringrepaired_influxdbData_1
Starting dockermonitoringrepaired_influxdb_1
Starting dockermonitoringrepaired_grafana_1
Starting dockermonitoringrepaired_cadvisor_1
...
influxdb_1 | [monitor] 2016/10/25 16:48:44 Storing statistics in database '_internal' retention policy 'monitor', at interval 10s
influxdb_1 | 2016/10/25 16:48:44 Sending anonymous usage statistics to m.influxdb.com
influxdb_1 | [run] 2016/10/25 16:48:44 Listening for signals
Step 4: CURL-Test
Now, the curl test is successful:
$ curl --retry 10 --retry-delay 5 -v http://localhost:8083
* Rebuilt URL to: http://localhost:8083/
* Hostname was NOT found in DNS cache
* Trying ::1...
* Connected to localhost (::1) port 8083 (#0)
> GET / HTTP/1.1
> User-Agent: curl/7.35.0
...
</body>

</html>
* Connection #0 to host localhost left intact
Also this is successful now.
Appendix: Error: load error nokogiri/nokogiri LoadError Vagrant
This is an error I have encountered after installing Vagrant 1.8.1 on Windows 10 and …