
Today, we will first introduce Logstash, an open source project created by Elastic, before we perform a little Logstash „Hello World“: we will show how to read data from command line or from file, transform the data and send it back to command line or file. In the appendix you will find a note on Logstash CSV input performance and on how to replace the timestamp by a custom timestamp read from the input message (e.g. the input file).
For a maximum of interoperability with the host system (so the used java version becomes irrelevant), Logstash will be run in a Docker-based container sandbox.
This is the first blog post of a series about the Elastic Stack (a.k.a. ELK stack):
- Part 1: Logstash „Hello World“ Example (this blog post) shows how to collect and translate log data with Logstash 5
- Part 2: Elasticsearch „Hello World“ Example introduces Elasticsearch 5 for big data analysis applied to Logstash-collected data
- Part 3: Kibana „Hello World“ Example introduces Kibana 5 for data visualization and binds Logstash, Elasticsearch and Kibana together
What is Logstash?
Logstash can collect logging data from a multitude of sources, transform the data, and send the data to a multitude of „stashes“.
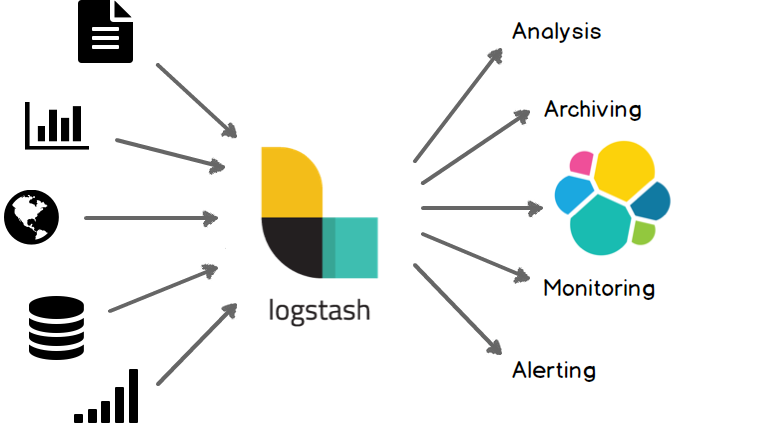
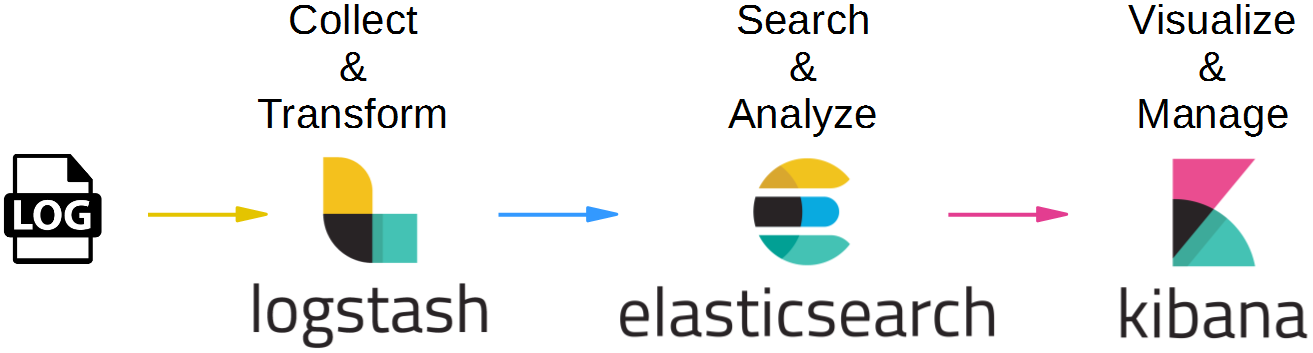
Elastic’s „favorite stash“ is Elasticsearch, another open source project driven by Elastic. Together with Kibana, Logstash and Elastic build the so-called ELK pipeline:
- Elasticsearch is for searching, analyzing, and storing your data
- Logstash (and Beats) is for collecting and transforming data, from any source, in any format
- Kibana is a portal for visualizing the data and to navigate within the elastic stack
In the current blog post, we will restrict ourselves to simplified Hello World Pipelines like follows:
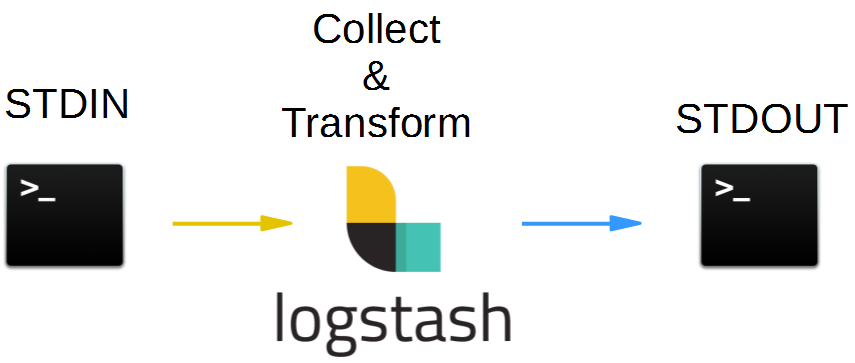
and:
We will first read and write to from command line, before we will use log files as input source and output destinations.
Tools used
- Vagrant 1.8.6
- Virtualbox 5.0.20
- Docker 1.12.1
- Logstash 5.0.1
Step 1: Install a Docker Host via Vagrant and Connect to the Host via SSH
We will run Logstash in a Docker container in order to allow for maximum interoperability. This way, we always can use the latest Logstash version without the need to control the java version used: e.g. Logstash v 1.4.x works with java 7, while version 5.0.x works with java 8 only, currently.
If you are new to Docker, you might want to read this blog post.
Installing Docker on Windows and Mac can be a real challenge, but no worries: we will show an easy way here, that is much quicker than the one described in Docker’s official documentation:
Prerequisites of this step:
- I recommend to have direct access to the Internet: via Firewall, but without HTTP proxy. However, if you cannot get rid of your HTTP proxy, read this blog post.
- Administration rights on you computer.
Steps to install a Docker Host VirtualBox VM:
Download and install Virtualbox (if the installation fails with error message „Oracle VM Virtualbox x.x.x Setup Wizard ended prematurely“ see Appendix A of this blog post: Virtualbox Installation Workaround below)
1. Download and Install Vagrant (requires a reboot)
2. Download Vagrant Box containing an Ubuntu-based Docker Host and create a VirtualBox VM like follows:
(basesystem)# mkdir ubuntu-trusty64-docker ; cd ubuntu-trusty64-docker
(basesystem)# vagrant init williamyeh/ubuntu-trusty64-docker
(basesystem)# vagrant up
(basesystem)# vagrant ssh
(dockerhost)$
Now you are logged into the Docker host and we are ready for the next step: to create the Ansible Docker image.
Note: I have experienced problems with the vi editor when running
vagrant sshin a Windows terminal. In case of Windows, consider to follow Appendix C of this blog post and to use putty instead.
Step 2 (optional): Download Logstash Image
This extra download step is optional, since the Logstash Docker image will be downloaded automatically in step 3, if it is not already found on the system:
(dockerhost)$ sudo docker pull logstash
Unable to find image 'logstash:latest' locally
latest: Pulling from library/logstash

386a066cd84a: Already exists
75ea84187083: Already exists
3e2e387eb26a: Pull complete
eef540699244: Pull complete
1624a2f8d114: Pull complete
7018f4ec6e0a: Pull complete
6ca3bc2ad3b3: Pull complete
3829939e7052: Pull complete
1cf20bb3ce62: Pull complete
f737f281552e: Pull complete
f1b7aca72edd: Pull complete
fb821ca73c54: Pull complete
c1543e80c12a: Pull complete
566f64970d2a: Pull complete
de88d0e92195: Pull complete
Digest: sha256:048a18100f18cdec3a42ebaa42042d5ee5bb3acceacea027dee4ae3819039da7
Status: Downloaded newer image for logstash:latest
The version of the downloaded Logstash image can be checked with following command:
(dockerhost)$ sudo docker run -it --rm logstash --version
logstash 5.0.1
We are using version 5.0.1 currently.
Step 3: Run Logstash als a Translator from Command Line to Command Line
In this step, we will use Logstash to translate the command line standard input (STDIN) to command line standard output (STDOUT).
Once a docker host is available, downloading, installing and running Logstash is as simple as typing following command. If the image is already downloaded, because Step 2 was accomplished before, the download part will be skipped:
(dockerhost)$ sudo docker run -it --rm logstash -e 'input { stdin { } } output { stdout { } }'The with the -e option, we tell Logstash to read from the command line input (STDIN) and to send all output to the command line STOUT.
The output looks like follows:
Unable to find image 'logstash:latest' locally
latest: Pulling from library/logstash

386a066cd84a: Already exists
75ea84187083: Already exists
3e2e387eb26a: Pull complete
eef540699244: Pull complete
1624a2f8d114: Pull complete
7018f4ec6e0a: Pull complete
6ca3bc2ad3b3: Pull complete
3829939e7052: Pull complete
1cf20bb3ce62: Pull complete
f737f281552e: Pull complete
f1b7aca72edd: Pull complete
fb821ca73c54: Pull complete
c1543e80c12a: Pull complete
566f64970d2a: Pull complete
de88d0e92195: Pull complete
Digest: sha256:048a18100f18cdec3a42ebaa42042d5ee5bb3acceacea027dee4ae3819039da7
Status: Downloaded newer image for logstash:latest
Sending Logstash's logs to /var/log/logstash which is now configured via log4j2.properties
The stdin plugin is now waiting for input:
11:19:07.293 [[main]-pipeline-manager] INFO  logstash.pipeline - Starting pipeline {"id"=>"main", "pipeline.workers"=>2, "pipeline.batch.size"=>125, "pipeline.batch.delay"=>5, "pipeline.max_inflight"=>250}
11:19:07.334 [[main]-pipeline-manager] INFO  logstash.pipeline - Pipeline main started
11:19:07.447 [Api Webserver] INFO  logstash.agent - Successfully started Logstash API endpoint {:port=>9600}
In the first part, the Logstash Docker image is downloaded from Docker Hub, if the image is not already available locally. Then there are the logs of the Logstash start and the output is stopping and is waiting for your input. Now, if we type
hello logstash
we get an output similar to
2016-11-17T11:35:10.764Z 828389ba165b hello logstash
We can stop the container by typing <Ctrl>-D and we will get an output like
11:51:20.132 [LogStash::Runner] WARN logstash.agent - stopping pipeline {:id=>"main"}Now let us try another output format:
(dockerhost)$ sudo docker run -it --rm logstash -e 'input { stdin { } } output { stdout { codec => rubydebug } }'
Sending Logstash's logs to /var/log/logstash which is now configured via log4j2.properties
The stdin plugin is now waiting for input:
11:48:05.746 [[main]-pipeline-manager] INFO logstash.pipeline - Starting pipeline {"id"=>"main", "pipeline.workers"=>2, "pipeline.batch.size"=>125, "pipeline.batch.delay"=>5, "pipeline.max_inflight"=>250}
11:48:05.760 [[main]-pipeline-manager] INFO logstash.pipeline - Pipeline main started
11:48:05.827 [Api Webserver] INFO logstash.agent - Successfully started Logstash API endpoint {:port=>9600}
You will need to wait for ~8 sec before you can send your first log to the STDIN. Let us do that now and type:
hello logstash in ruby style
This will produce an output like
{
"@timestamp" => 2016-11-17T11:50:24.571Z,
"@version" => "1",
"host" => "9cd979a20db4",
"message" => "hello logstash in ruby style",
"tags" => []
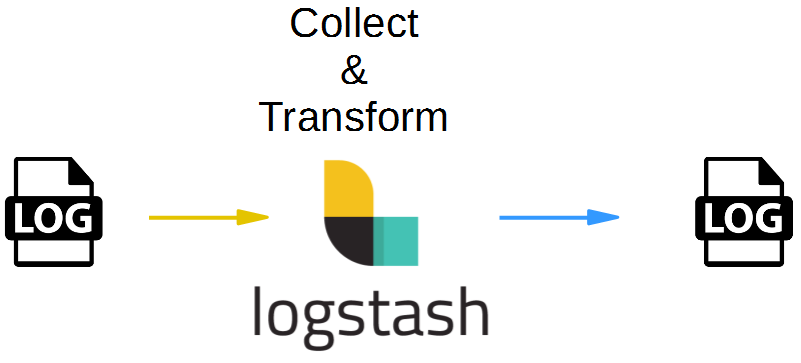
}Step 3: Run Logstash als a Translator from from File to File
In this example, we will use (log) files as input source and output destination:

For this, we will create a Logstash configuration file on the Docker host as follows:
#logstash.conf
input {
  file {
    path => "/app/input.log"
  }
}

output {
  file {
    path => "/app/output.log"
  }
}
For being able to read a file in the current directory on the Docker host, we need to map the current directory to a directory inside the Docker container using the -v switch. This time we need to override the entrypoint, since we need to get access to the command line of the container itself. We cannot just
(dockerhost-terminal1)$ sudo docker run -it --rm --name logstash -v "$PWD":/app --entrypoint bash logstash
Then within the container we run logstash:
(container-terminal1)# logstash -f /app/logstash.conf
In a second terminal on the docker host, we need to run a second bash terminal within the container by issuing the command:
(dockerhost-terminal2)$ sudo docker exec -it logstash bash
Now, on the container command line, we prepare to see the output like follows:
(container-terminal2)# touch /app/output.log; tail -f /app/output.log
Now we need a third terminal, and connect to the container again. Then we send a „Hello Logstash“ to the input file:
(dockerhost-terminal3)$ sudo docker exec -it logstash bash
(container-terminal3)# echo "Hello Logstash" >> /app/input.log
This will create following output on terminal 2:
{"path":"/app/input.log","@timestamp":"2016-11-17T19:53:02.728Z","@version":"1","host":"88a342b6b385","message":"Hello Logstash","tags":[]}
The output is in a format Elasticsearch understands.
In order to improve the readability of the output, we can specify a „plain“ output codec in the configuration file:
#logstash.conf
input {
  file {
    path => "/app/input.log"
  }
}

output {
  file {
    path => "/app/output.log"
    codec => "plain"
  }
}
Note that a change of the Logstash configuration file content requires the logstash process to be restarted for the change to have an effect; i.e. we can stop it with Ctrl-C and restart the logstash process in terminal 1 it with
(container-terminal1)# logstash -f /app/logstash.conf
Now again
(container-terminal-3)# echo "Hello Logstash" >> /app/input.log
in terminal 3. That will produce following syslog-style output on terminal 2:
2016-11-17T20:10:39.861Z 88a342b6b385 Hello Logstash
Appendix A: Error Errno::EACCES: Permission denied if the logfile is changed from on a mapped Volume
This error has been seen by running Logstash as a Docker container with a mapped folder and manipulate the input file from the Docker host
(dockerhost)$ sudo docker run -it --rm -v "$PWD":/app logstash -f /app/logstash.conf
Sending Logstash's logs to /var/log/logstash which is now configured via log4j2.properties
19:15:59.927 [[main]-pipeline-manager] INFO logstash.pipeline - Starting pipeline {"id"=>"main", "pipeline.workers"=>2, "pipeline.batch.size"=>125, "pipeline.batch.delay"=>5, "pipeline.max_inflight"=>250}
19:15:59.940 [[main]-pipeline-manager] INFO logstash.pipeline - Pipeline main started
19:16:00.005 [Api Webserver] INFO logstash.agent - Successfully started Logstash API endpoint {:port=>9600}
If we now change the input file on the docker host in a second terminal like follows:
(dockerhost)$ echo "Hello Logstash" >> input.log
we receive following output on the first terminal:
19:22:47.732 [[main]>worker1] INFO logstash.outputs.file - Opening file {:path=>"/app/output.log"}
19:22:47.779 [LogStash::Runner] FATAL logstash.runner - An unexpected error occurred! {:error=>#<Errno::EACCES: Permission denied - /app/output.log>, :backtrace=>["org/jruby/RubyFile.java:370:in `initialize'", "org/jruby/RubyIO.java:871:in `new'", "/usr/share/logstash/vendor/bundle/jruby/1.9/gems/logstash-output-file-4.0.1/lib/logstash/outputs/file.rb:280:in `open'", "/usr/share/logstash/vendor/bundle/jruby/1.9/gems/logstash-output-file-4.0.1/lib/logstash/outputs/file.rb:132:in `multi_receive_encoded'", "org/jruby/RubyHash.java:1342:in `each'", "/usr/share/logstash/vendor/bundle/jruby/1.9/gems/logstash-output-file-4.0.1/lib/logstash/outputs/file.rb:131:in `multi_receive_encoded'", "org/jruby/ext/thread/Mutex.java:149:in `synchronize'", "/usr/share/logstash/vendor/bundle/jruby/1.9/gems/logstash-output-file-4.0.1/lib/logstash/outputs/file.rb:130:in `multi_receive_encoded'", "/usr/share/logstash/logstash-core/lib/logstash/outputs/base.rb:90:in `multi_receive'", "/usr/share/logstash/logstash-core/lib/logstash/output_delegator_strategies/shared.rb:12:in `multi_receive'", "/usr/share/logstash/logstash-core/lib/logstash/output_delegator.rb:42:in `multi_receive'", "/usr/share/logstash/logstash-core/lib/logstash/pipeline.rb:297:in `output_batch'", "org/jruby/RubyHash.java:1342:in `each'", "/usr/share/logstash/logstash-core/lib/logstash/pipeline.rb:296:in `output_batch'", "/usr/share/logstash/logstash-core/lib/logstash/pipeline.rb:252:in `worker_loop'", "/usr/share/logstash/logstash-core/lib/logstash/pipeline.rb:225:in `start_workers'"]}
(dockerhost)$
There is a problem with the synchronization of the input.log file from the Docker host to the Container causing the docker container to stop. The workaround is to run the container with a bash entrypoint and manipulate the file from within the container, as shown in the step by step guide above.
Appendix B: How to apply a custom Time Stamp
In a real customer project, I had the task to visualize the data of certain data dump files, which had their own time stamps in a custom format like follows:
2016-11-21|00:00:00|<other data>
Okay, you are right in thinking that this is a CSV with pipe (|) separator, and that the CSV Logstash plugin should be applied. However, before doing so, we can take it as an example on how to replace the built-in Logstash timestamp variable called @timestamp. This is better than creating your own timestamp variable with a different name. The latter is possible also and works with normal Kibana visualizations, but it does not seem to work with Timelion for more complex visualizations. So let us do it the right way now:
We will create a simple demonstration Logstash configuration file for demonstration of the topic like follows:
# logstash_custom_timestamp.conf
input {
  stdin { }
  file {
    path => "/app/input/*.*"
    start_position => "beginning"
    sincedb_path => "/dev/null"
  }
}
With that, will allow for STDIN input as well as for file input from any file you dump into the path /app/input/*. For testing, we have set the start_position to the „beginning“. I.e., Logstash will always read the files from the beginning, even if it already has read part of it. In addition, by setting the sincedb_path to "/dev/null", we make sure, that Logstash forgets about which files are already processed. This way, we can restart Logstash and re-process any files in the folder.
Now let us find the time variable with a grok filter and replace the time variable with the date plugin:
filter {
  grok {
    match => {"message" => "(?<mydate>[1-9][0-9]{3}-[0-9]{2}-[0-9]{2}\|[0-9]{2}:[0-9]{2}:[0-9]{2})"}
  }

  date {
    match => ["mydate", "YYYY-MM-dd|HH:mm:ss", "MMM  d HH:mm:ss", "MMM dd HH:mm:ss", "ISO8601"]
    target => "@timestamp"
  }

}
The grok filter allows us to define a new interim variable named mydate, if the specified regular expression is found in the input message. In our case, we want to match something like 2016-11-21|00:00:00, i.e. one digit between 1 and 9 ([1-9]) and 3 digits between 0 and 9 ([0-9]{3}), then a dash (-), then two digits ([0-9]{2}), a.s.o.
Then we can use the date plugin to overwrite the built-in @timestamp with our variable mydate we have created with the grok filter. Within the date we can match clauses like YYYY-MM-dd|HH:mm:ss in the mydate variable and push it to the @timestamp variable.
Note, that it is not possible to just use the replace directive. If we just try to overwrite @timestamp with mydate using the replace directive, Logstash will complain that you cannot overwrite a time variable with a String variable.
output {
  stdout { codec => rubydebug }
}
Now, let us start Logstash in a Docker container and test the configuration:
(dockerhost)$ sudo docker run -it --rm --name logstash -v "$PWD":/app --entrypoint bash logstash
(container)$ logstash -f /app/logstash_custom_timestamp.conf
And now, the container is waiting for input. We do not let it wait and we type in the line below in fat:
1966-10-23|12:00:00|birthday
{
 "mydate" => "1966-10-23|12:00:00",
 "@timestamp" => 1966-10-23T12:00:00.000Z,
 "@version" => "1",
 "host" => "02cec85c3aac",
 "message" => "1966-10-23|12:00:00|birthday",
 "tags" => []
}
Success: the built-in timestamp variable @timestamp has been updated with the date found in the input message.
Let us observe, what happens with input messages, which do not match:
this is a message that does not match
{
    "@timestamp" => 2016-12-04T10:19:17.501Z,
      "@version" => "1",
          "host" => "02cec85c3aac",
       "message" => "this is a message that does not match",
          "tags" => [
        [0] "_grokparsefailure"
    ]
}
We can see that the output is tagged with "_grokparsefailure" in this case and the timestamp is set to the current date and time, as expected.
Appendix C: Logstash CSV read Performance
In a real project, I had to read in many millions of lines of a large set of CSV files. I have experienced that it took quite a bit of time to read in the data, so I want to measure the input performance of Logstash to be able to calculate the time consumption.
Note: we will reduce the data volume by a random sampling of the input. This will optimize input and Elasticsearch performance with the trade-off that the data analysis will become less accurate. However, if each data point still has more than 100 samples, the error is expected to lower than a few per cent, if the input data has no „unhealthy“ values distribution (e.g. many records with low values and only few records with very large values).
Tools used:
- Notebook with i7-6700HQ CPU and 64 GB RAM and Windows 10 Pro
- VirtualBox 5.0.20 r106931
- VirtualBox VM with Ubuntu 14.04, 4GB RAM and 2 vCPU
- Docker installed 1.12.1, build 23cf638
- 3 Docker containers running in interactive mode (the performance in detached mode might be higher, so we will measure a lower bound of the performance):
- Logstash 5.0.1
- Elasticsearch 5.0.1
- Kibana 5.0.1
- Data input files:
- CSV files with 12200 lines
- Sample data lines (note that the first line of each file will be dropped by Logstash):
DATUM|ZEIT|IPV4_SRC_ADDR|IPV4_DST_ADDR|ROUTER_IP|INTF_IN|INTF_OUT|TOS|FLAGS|IP_PROTOCOL_VERSION|PROTOCOL|L4_SRC_PORT|L4_DST_PORT|IN_PKTS|IN_BYTES|FLOWS
2016-11-23|15:58:10|9.1.7.231|164.25.118.50|9.0.253.1|2|0|0|0|4|17|49384|161|6|1602|1
2016-10-23|15:58:12|9.1.7.231|9.60.64.1|9.0.253.1|2|2|0|0|4|17|51523|161|1|78|1
...
Logstash configuration
# logstash_netflow_csv_to_elasticsearch.conf
input {
  stdin { }
  file {
    path => "/app/input/*.*"
    start_position => "beginning"
    sincedb_path => "/dev/null"
  }
}

filter {
  ruby {
    # Sampling:
    code => "event.cancel if rand <= 0.90" # 10% sampling (i.e. cancel 90% of events)
    #code => "event.cancel if rand <= 0.99" # 1% sampling (i.e. cancel 99% of events)
  }

  # set timestamp: read from message
  grok {
    match => {"message" => "(?[1-9][0-9]{3}-[0-9]{2}-[0-9]{2}\|[0-9]{2}:[0-9]{2}:[0-9]{2})"}
  }

  # set timestamp: overwrite time stamp
  date {
    match => ["mydate", "YYYY-MM-dd|HH:mm:ss", "MMM  d HH:mm:ss", "MMM dd HH:mm:ss", "ISO8601"]
    target => "@timestamp"
  }

  csv {

    columns => [
      "DATUM",
      "ZEIT",
      "IPV4_SRC_ADDR",
      "IPV4_DST_ADDR",
      "ROUTER_IP",
      "INTF_IN",
      "INTF_OUT",
      "TOS",
      "FLAGS",
      "IP_PROTOCOL_VERSION",
      "PROTOCOL",
      "L4_SRC_PORT",
      "L4_DST_PORT",
      "IN_PKTS",
      "IN_BYTES",
      "FLOWS"
    ]

    separator => "|"
    remove_field => ["mydate"]
  }

  if ([DATUM] == "DATUM") {
    drop { }
  }

}

output {
  stdout { codec => dots }

  elasticsearch {
    action => "index"
    index => "csv"
    hosts => "elasticsearch"
    document_type => "data"
    workers => 1
  }
}
Results without Elasticsearch output
As a base line, we will perform tests with the elaisicsearch output commented out first:
Test 1) 100% Sampling -> 3,400/sec (i.e. 3,400 data sets/sec)
(10 files with 12,200 lines each in ~35 sec)
Test 2) 10% Sampling -> 6,100 lines/sec (i.e. 610 data sets/sec)
(10 files with 12,200 lines each in ~20 sec)
Test 3) 1% Sampling -> 8,100 lines/sec (i.e. 81 data sets/sec)
(10 files with 12,200 lines each in ~15 sec)
Results with Elasticsearch output
Now let us test the performance in case the data is sent to Elasticsearch:
Test 1) 100% Sampling -> 1,700/sec with 1,700 data lines/sec
(10 files with 12,200 lines each in ~70 sec)
Test 2) 10% Sampling -> 3,500 lines/sec with 350 data lines/sec
(10 files with 12,200 lines each in ~35 sec)
Test 3) 1% Sampling -> 6,100 lines/sec (i.e. 61 data sets/sec)
(10 files with 12,200 lines each in ~20 sec)
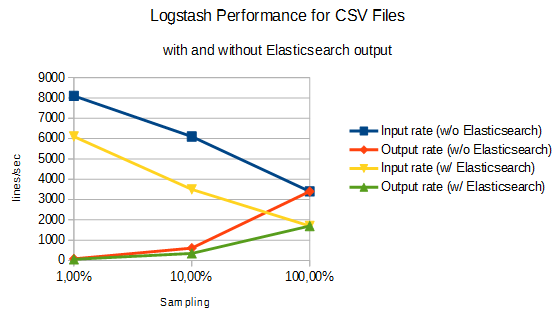
As we can see, the input rate is about 2000 lines/sec lower, if the output is sent Elasticsearch instead of sending it to console only (dots) (yellow vs. blue line).
In case of output to Elasticsearch, we get following rates graph:
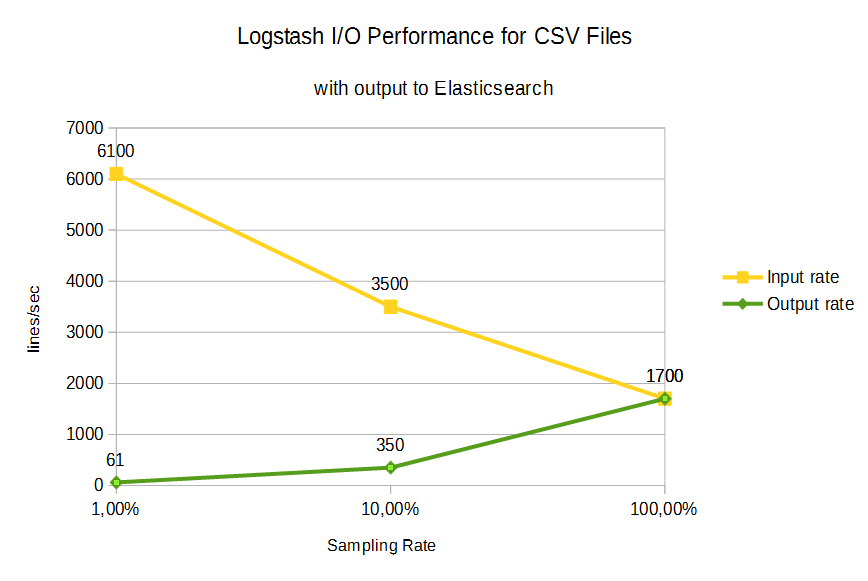
- Sampling rate 1%: if only 1% of the data records are sent to the output, the input rate is increased to 6,100 (factor ~3.6 compared to a sampling rate of 100%).
- Sampling rate 10%: if only 10% of the data records are sent to the output, one could expect an input rate increase by the factor 10 compared to 100% sampling, if the output pipe was the bottleneck. This does not seem to be the case, since we observe an increase by the factor 2 only (3,500 lines/sec).
- Sampling rate 100%: if all input lines are sent to the output, we can reach ~ 1,700 lines/sec
The optimum sampling rate is determined by increasing the sampling rate until the required data accuracy is reached. The data accuracy can be checked by random sampling of the same set of data several times and to observe variance of the output.
Summary
In this blog post we have created two simple Hello World examples:
- one for translation between command line input and command line output and
- a second one for translation from a file to a file.
In order to avoid any compatibility issues with the java version on the host, we have run Logstash in a Docker container. This works fine, if the input file is manipulated from within the container. As seen in Appendix A, we cannot manipulate the file on a mapped volume on the Docker Host, though.
References
- A simple hello world for STDIN to STDOUT can be found on Kevin Kirsche’s Blog.
- The File to File Examples can be found on this youtube video.