In our most recent blog post, we have shown how to install ElasticSearch via Helm. This time, we will add a Kibana server (via Helm again), so we can visualize the data stored in the ElasticSearch database.
Compared to the installation of the ElasticSearch, the installation of Kibana is quite simple. The default stable Helm chart for Kibana is just a single node installation and the resource needs are not too high.
Prerequisites
- ElasticSearch is installed and the ElasticSearch URL is accessible. You may want to follow the ElasticSearch installation instructions on our previous article.
Step 1: Configuration and Detection of the ElasticSearch URL
[ "$RELEASE" == "" ] \
  && RELEASE=kibana-v1
[ "$ELASTICSEARCH_URL" == "" ] \
  && ELASTICSEARCH_URL=http://$(kubectl get svc -n elasticsearch | grep 'elastic.*client' | head -n 1 | awk '{print $1}'):9200
In case the ElasticSearch server has not been installed via Helm by following our previous article, it might be necessary to manually define the ElasticSearch URL via something like follows:
export ELASTICSEARCH_URL=http://your-elasticsearch-server:9200
Step 2: Install Kibana
For installing Kibana, we need to tell Kibana
helm install stable/kibana --name kibana-v1 \
  --set env.ELASTICSEARCH_URL=${ELASTICSEARCH_URL} \
  --set files.kibana.yml.elasticsearch.url=${ELASTICSEARCH_URL} \
  --set service.externalPort=5601 \
  --namespace elasticsearch
Here we have chosen to overwrite the externalPort 443 with 5601 since we have not planned to install TLS.
The output should look similar to the following:
NAME:   kibana-v1
LAST DEPLOYED: Wed Mar  6 21:28:33 2019
NAMESPACE: elasticsearch
STATUS: DEPLOYED

RESOURCES:
==> v1beta1/Deployment
NAME       DESIRED  CURRENT  UP-TO-DATE  AVAILABLE  AGE
kibana-v1  1        1        1           0          0s

==> v1/Pod(related)
NAME                       READY  STATUS             RESTARTS  AGE
kibana-v1-6f674c7f-bd7l8   1/1    Terminating        0         2m54s
kibana-v1-8c5445487-2hvct  0/1    ContainerCreating  0         0s

==> v1/ConfigMap
NAME       DATA  AGE
kibana-v1  2     0s

==> v1/Service
NAME       TYPE       CLUSTER-IP     EXTERNAL-IP  PORT(S)   AGE
kibana-v1  ClusterIP  10.99.174.220         5601/TCP  0s


NOTES:
To verify that kibana-v1 has started, run:

  kubectl --namespace=elasticsearch get pods -l "app=kibana"

Kibana can be accessed:

  * From outside the cluster, run these commands in the same shell:

    export POD_NAME=$(kubectl get pods --namespace elasticsearch -l "app=kibana,release=kibana-v1" -o jsonpath="{.items[0].metadata.name}")
    echo "Visit http://127.0.0.1:5601 to use Kibana"
    kubectl port-forward --namespace elasticsearch $POD_NAME 5601:5601
Step 3: Check the POD Status
Shortly after the installation, the Kibana POD should get up and reads:
kubectl get pods -n elasticsearch

# output:
NAME                                      READY   STATUS    RESTARTS   AGE
elasticsearch-v1-client-79b76549c-vj8k2   1/1     Running   0          21h
elasticsearch-v1-data-0                   1/1     Running   0          21h
elasticsearch-v1-master-0                 1/1     Running   0          21h
kibana-v1-8c5445487-2hvct                 1/1     Running   0          10m
Step 4: Access the Service locally
We read the cluster IP address from the output of the following command:
kubectl -n elasticsearch get svc

# output:
NAME                         TYPE        CLUSTER-IP       EXTERNAL-IP   PORT(S)    AGE
elasticsearch-v1-client      ClusterIP   10.106.165.136           9200/TCP   21h
elasticsearch-v1-discovery   ClusterIP   None                     9300/TCP   21h
kibana-v1                    ClusterIP   10.99.174.220            5601/TCP   22m
Let us access the service locally by accessing the CLUSTER-IP and the PORT 5601:
curl -D - 10.99.174.220:5601

# output:
HTTP/1.1 302 Found
location: /app/kibana
kbn-name: kibana
cache-control: no-cache
content-length: 0
connection: close
Date: Wed, 06 Mar 2019 20:55:17 GMT
We can see, that we have reached the Kibana server and we have received a redirect message pointing to /app/kibana. We can follow the redirect with the -L option:
curl -L -D - 10.99.174.220:5601 | less

# output:
HTTP/1.1 302 Found
location: /app/kibana
kbn-name: kibana
cache-control: no-cache
content-length: 0
connection: close
Date: Wed, 06 Mar 2019 20:57:56 GMT

HTTP/1.1 200 OK
kbn-name: kibana
cache-control: no-cache
content-type: text/html; charset=utf-8
content-length: 60151
accept-ranges: bytes
connection: close
Date: Wed, 06 Mar 2019 20:57:56 GMT

<!DOCTYPE html>...
Step 5: Access the Service remotely
There are several options on how we can access the service remotely. For a quick test, and if the Kubernetes worker node is located in a secured network, you can follow the instructions that were given after the helm install command was given and expose the service as follows:
Kibana can be accessed:

  * From outside the cluster, run these commands in the same shell:

    export POD_NAME=$(kubectl get pods --namespace elasticsearch -l "app=kibana,release=kibana-v1" -o jsonpath="{.items[0].metadata.name}")
    echo "Visit http://127.0.0.1:5601 to use Kibana"
    kubectl port-forward --namespace elasticsearch $POD_NAME 5601:5601
This will bind the address 127.0.0.1 port 5601 to the POD. However, we want to access the system from outside so we have to add the address 0.0.0.0:
kubectl port-forward --namespace elasticsearch --address 0.0.0.0 $POD_NAME 5601:5601
Security Note: we recommend to perform those steps only, if your server is secured from the Internet.
The output of the commands is:
Forwarding from 0.0.0.0:5601 -> 5601
Note: the input on the command line is blocked until we stop the port-forwarding with a <Ctrl>-C.
As long as the forwarding is active, the service can be accessed:
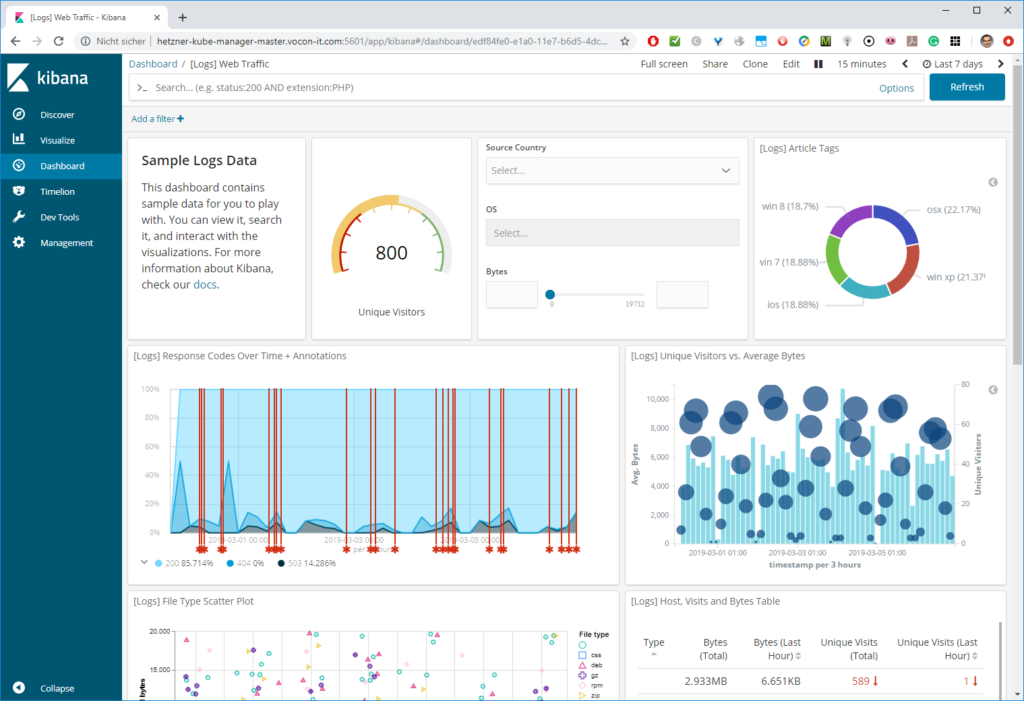
Step 6: Permanent Access of the Service
For permanent access, other ways of access need to be established. In a simple situation with a single node kubernetes „cluster“, the (IMO) simplest way is to adapt the service from Cluster IP to HostPort:
kubectl -n elasticsearch edit svc kibana-v1
The editor will open and we can manipulate the lines that are shown in blue below:
# Please edit the object below. Lines beginning with a '#' will be ignored,
# and an empty file will abort the edit. If an error occurs while saving this file will be
# reopened with the relevant failures.
#
apiVersion: v1
kind: Service
metadata:
  creationTimestamp: "2019-03-06T20:28:33Z"
  labels:
    app: kibana
    chart: kibana-1.1.2
    heritage: Tiller
    release: kibana-v1
  name: kibana-v1
  namespace: elasticsearch
  resourceVersion: "1589061"
  selfLink: /api/v1/namespaces/elasticsearch/services/kibana-v1
  uid: 69a48971-404e-11e9-ab19-9600001bfa15
spec:
  clusterIP: 10.99.174.220
  ports:
  - port: 5601
    protocol: TCP
    targetPort: 5601
    nodePort: 30000           <----- add this line
  selector:
    app: kibana
    release: kibana-v1
  sessionAffinity: None
  type: NodePort              <----- change from ClusterIP to NodePort
status:
  loadBalancer: {}
With that, the service can be accessed permanently on port 30000 of the IP address of the kubernetes node:

Note that the NodePorts need to be in the range 30000-32767. If you desire to use standard ports like 5601, check out this blog post for an example how to expose services on HTTP or HTTPS via an NginX-based Ingress solution. The latter solution can handle services on a Kubernetes cluster.
Summary
In this article, we have learned, how easy it is to deploy a Kibana server on Kubernetes via Helm. We just had to manipulate the ElasticSearch URL and the external Port. We also have shown how to access the service via Kubernetes port-forwarding (temporary solution) or via a simple node port configuration with a high TCP port beyond 30.000 (persistent solution). Better, NginX-based solutions are found here.

I don’t think the title of your article matches the content lol. Just kidding, mainly because I had some doubts after reading the article.