
You also think that functional tests are one of the most important ingredients for delivering high quality software? You share my opinion that we should help the developer automating this task in order to get comparable results and to receive meaningful trend reports?
I will cover functional tests here. Instructions on how to perform code quality tests and performance tests are in draft status and will be covered in the next two blog posts.
Any questions and/or comments are highly welcome.
Introduction
As a developer you try hard to deliver high quality software.
You hate searching for this nasty bug that had been introduced unnoticed days ago. Or was it weeks ago? By whom? In which code?
Manual functional and performance testing after each commited code change quickly becomes a NO-GO as the number of features is rising constantly. In this blog post, we will show, how Jenkins can help you with both: delivering high quality software and minimizing the time needed to find the cause of a bug.
How about …
- creating automated tests for each functionality and performance at different levels (end to end, and unit tests)
- running the automated tests after each code change
- keeping track of the test results
… in order to avoid any bad surprises late in the game?
Okay: for 1., the developer needs to create automated functional and perfomance tests; I guess, there is no way around this. Better do this even before writing the actual code. For 2. and 3., however, automation tools like Jenkins step in and can be of great help. The developers checks in the code and Jenkins can do the rest for you.
In the current blog post, we will show how to integrate automated JUnit functional tests into a Jenkins build pipeline. We will see that JUnit tests can be invoked easily via Gradle (Okay, Maven is more popular than Gradle, I guess, but I like Gradle because of some advantages I have discussed here; However, just give me a hint in a comment to this blog and I will prioritize the creation of a Maven version of this blog post). The Jenkins JUnit plug-in will be used to
- display reports on single build runs as well as
- display trend analysis graphs like the following one I have borrowed from here:

In this and the next two blog posts, we plan to cover following quality gate measures:
- Part 4.1: Functional Tests (this blog post): we will use Java JUnit tests performed before building the executable JAR. Jenkins will report the test trend
- Part 4.2: Code Quality Tests (coming soon): we will use the Checkstyle Gradle plugin for reporting to which degree the code adheres to the Apache Foundations formal rules
- Part 4.3: Performance Tests (planned): we will use JMeter for testing and reporting the performance trend performed after the Java build using external performance testers like JMeter
Older blogs of this series:
This blog post series about Jenkins build pipelines is divided into following parts:
What is Jenkins?
Jenkins is the leading open source automation server mostly used in continuous integration and continuous deployment pipelines. Jenkins provides hundreds of plugins to support building, deploying and automating any project.
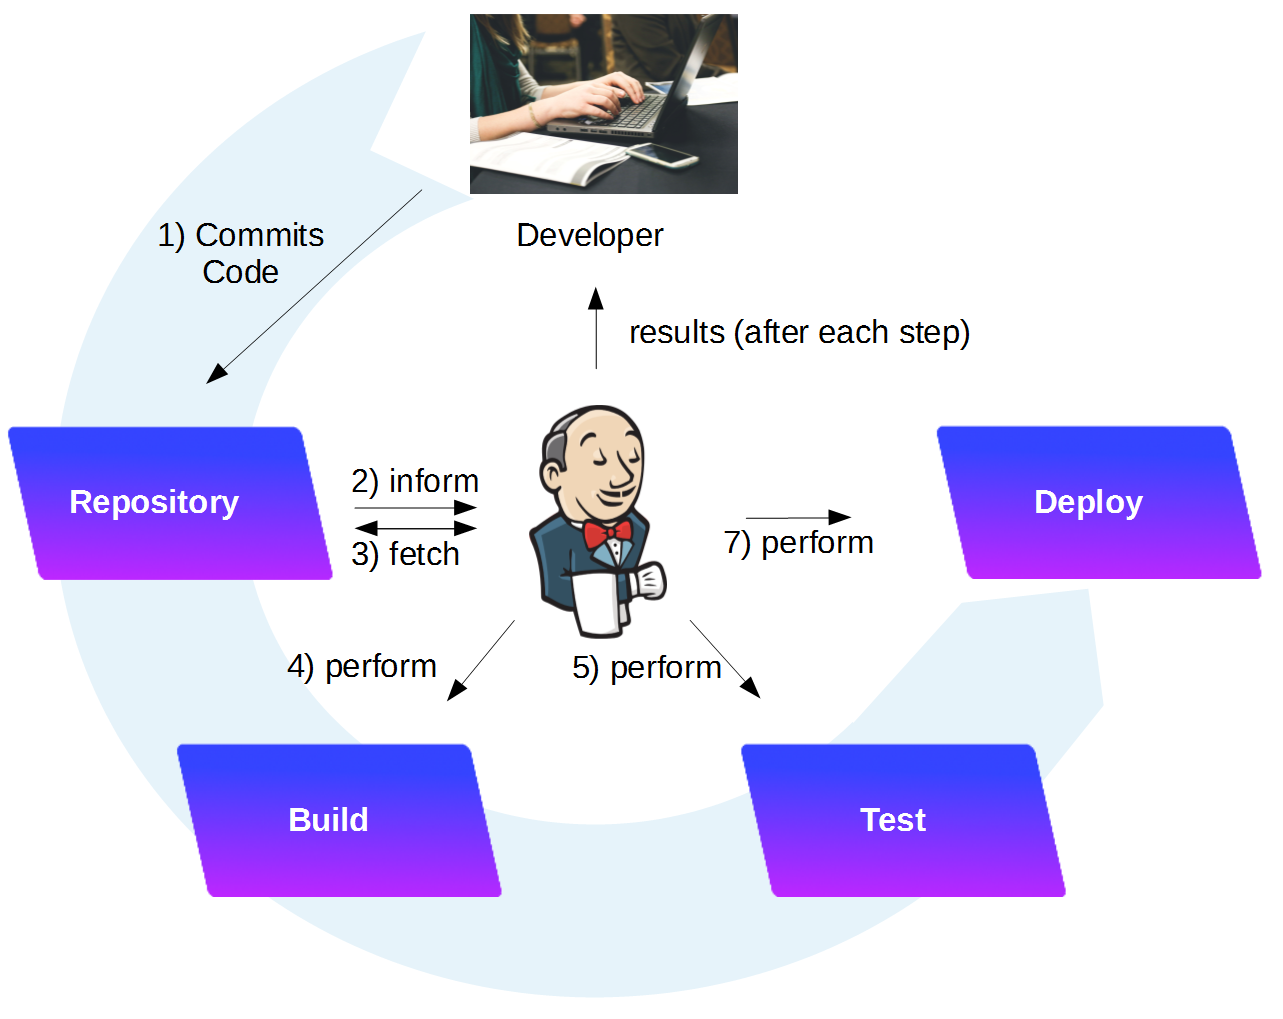
A typical workflow is visualized above: a developer checks in the code changes into the repository. Jenkins will detect the change, build (compile) the software, test it and prepare to deploy it on a system. Depending on the configuration, the deployment is triggered by a human person, or automatically performed by Jenkins. After each step, the developer is informed depending on the priorites defined.
For more information, see the introduction found in part 1 of this blog series.
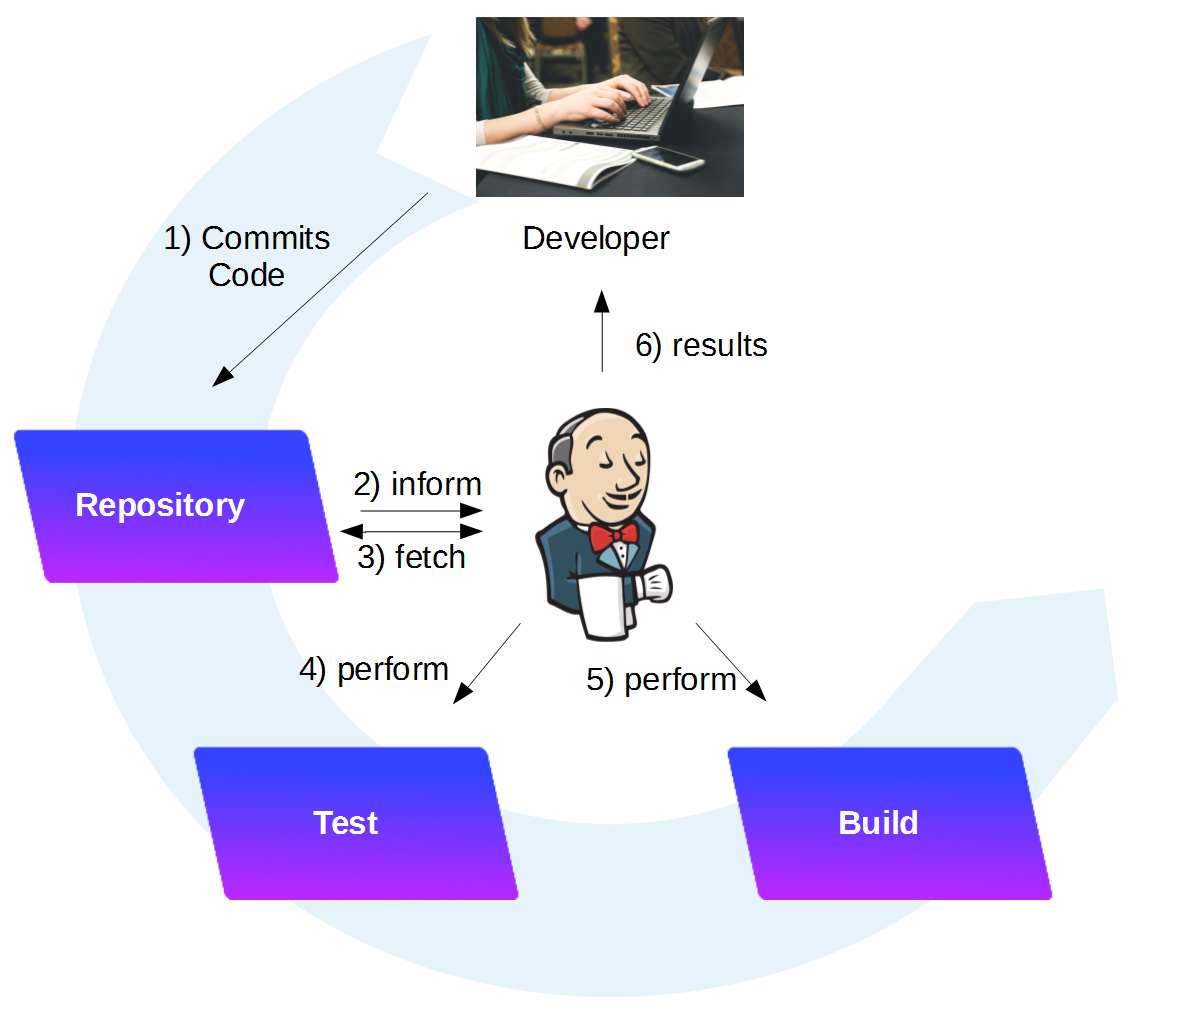
Automated Functional Testing based on JUnit
In this blog post, we will show how we need to configure Gradle and Jenkins for automated JUnit testing and reporting. In order to build a quality gate, we will reverse the original order and perform the JUnit tests before we build the executable JAR file (we do not want to create JAR files that are not functional):
Tools used
- Vagrant 1.8.6
- Virtualbox 5.0.20
- Docker 1.12.1
- Jenkins 2.19.3
- JUnit Plug-in 1.19
Prerequisites:
Step 1: Start Jenkins in interactive Terminal Mode
Make sure that port 8080 is unused on the Docker host. If you were following all steps in part 1 of the series, you might need to stop cadvisor:
(dockerhost)$ sudo docker stop cadvisor
I assume that jenkins_home is already created, all popular plugins are installed and an Admin user has been created as shown in part 1 of the blog series. We start the Jenkins container with the jenkins_home Docker host volume mapped to /var/jenkins_home:
(dockerhost)$ cd <path_to_jenkins_home> # in my case: cd /vagrant/jenkins_home/
(dockerhost:jenkins_home)$ sudo docker run -it --rm --name jenkins -p8080:8080 -p50000:50000 -v`pwd`:/var/jenkins_home jenkins
Running from: /usr/share/jenkins/jenkins.war
...
--> setting agent port for jnlp
--> setting agent port for jnlp... done
Step 2: Open Jenkins in a Browser
Now we want to connect to the Jenkins portal. For that, open a browser and open the URL
<your_jenkins_host>:8080
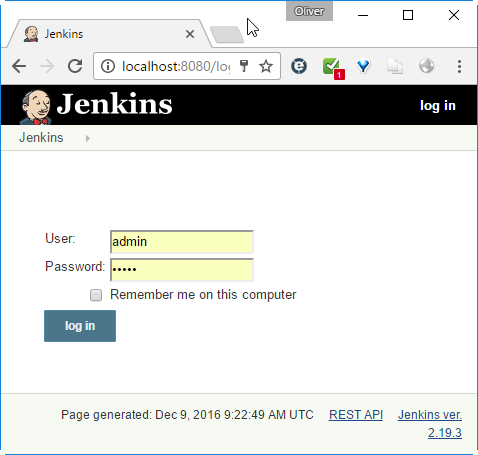
In our case, Jenkins is running in a container and we have mapped the container-port 8080 to the local port 8080 of the Docker host. On the Docker host, we can open the URL.
localhost:8080
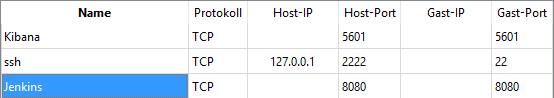
Note: In case of Vagrant with VirtualBox, per default, there is only a NAT-based interface and you need to create port-forwarding for any port you want to reach from outside (also the local machine you are working on is to be considered as outside). In this case, we need to add an entry in the port forwarding list of VirtualBox:
We have created this entry in part 1 already, but I have seen that the entries were gone again, which seems to be a VirtualBox bug. I have added it again now.
Log in with the admin account we have created in the last session:
Step 3: Pre-Build JUnit Tests invoked by Gradle
In this step, we will invoke Gradle Tests before building the JAR. For that, we should verify locally that the Gradle tests are successful and then define a test Gradle task in the build process.
Step 3.1 (optional): Verify that Gradle Tests are successful
You can skip this test and directly let Jenkins do this for you. This may come handy, if you have not installed Git and/or Gradle locally.
Prerequisites
- Your Java project has successful JUnit tests defined
- Git is installed
- The Project is cloned to a local directory
- Gradle is installed
In order to test, whether the JUnit tests are successful, we can test those on a system with the project cloned (git, java and gradle must be installed):
(basesystem)$ gradle test
Starting a Gradle Daemon (subsequent builds will be faster)
Parallel execution is an incubating feature.
:compileJava UP-TO-DATE
:processResources UP-TO-DATE
:classes UP-TO-DATE
:compileTestJava
warning: [options] bootstrap class path not set in conjunction with -source 1.6
1 warning
:processTestResources
:testClasses
:test

BUILD SUCCESSFUL

Total time: 29.9 secs
With that, we have verified that the command „gradle test“succeeds.
Note that the JUnit test must be designed in a way that they are independent of whether or not the JAR file is run in parallel. No simple way of running the executable JAR file in parallel to the execution of the JUnit tests seems to exist. In my case, I had to alter the JUnit tests to fulfill this prerequisite.
Step 3.2: Add Gradle test Task to Jenkins
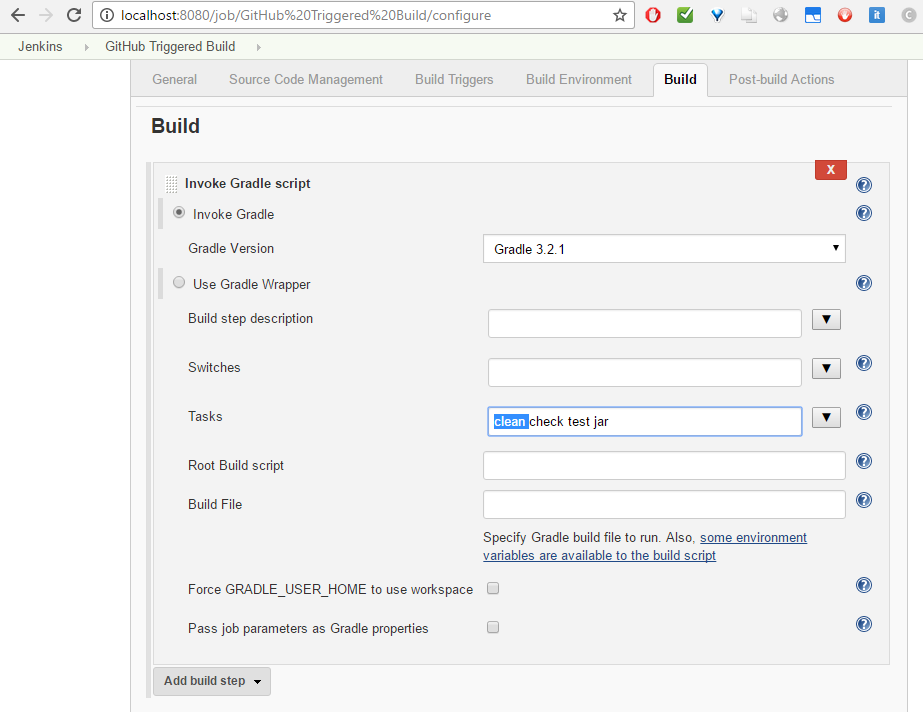
As long as JUnit tests are defined in src/test of the project, adding Gradle tests to Jenkiny is as simple as adding „test“ as a task to the list of Jenkins Build Gradle Tasks as follows:
On Dashboard -> Click on Project name -> Configure -> Build, add „task “ before the jar task:
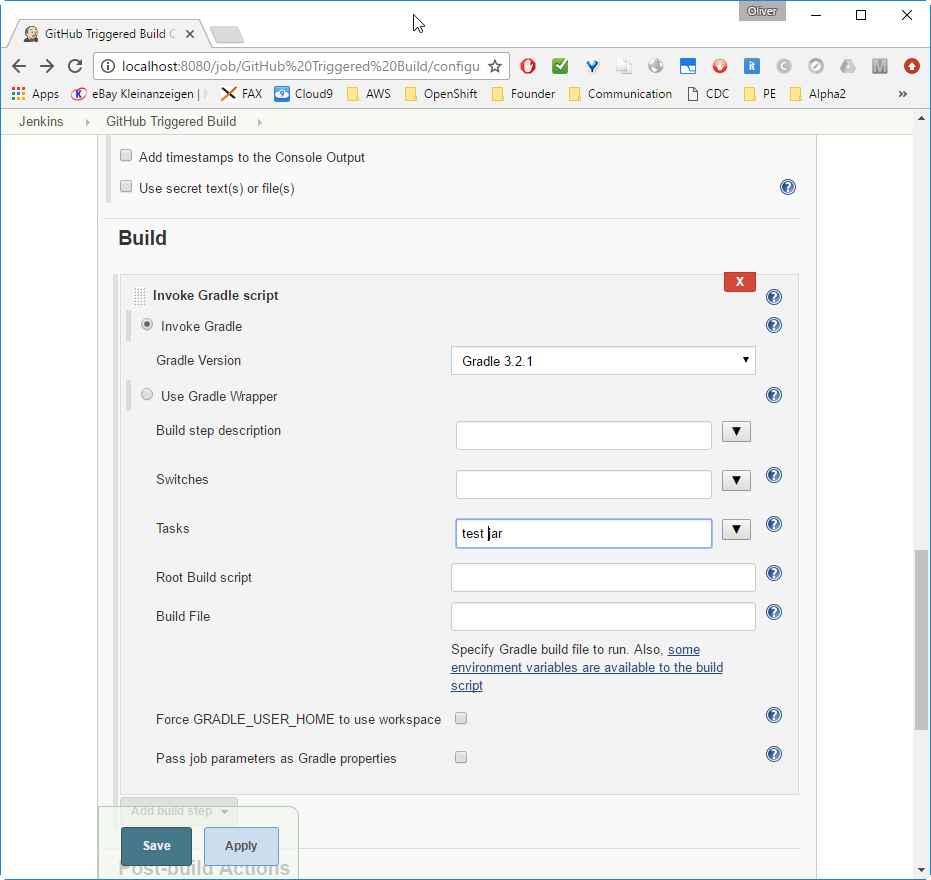
Click ![]() .
.
If you have made local code changes on the project, now is the best time to commit and push them to the Git repository. If you have followed the steps in part 3, then this will automatically trigger a build process, so you do not need to click on „Build now“ in that case. Otherwise, click on „Build now“ on the Jenkins project page (e.g. Dashboard -> click on project name -> „Build now“).
Now we observe the result by clicking on the build process, then -> „Console Output“:
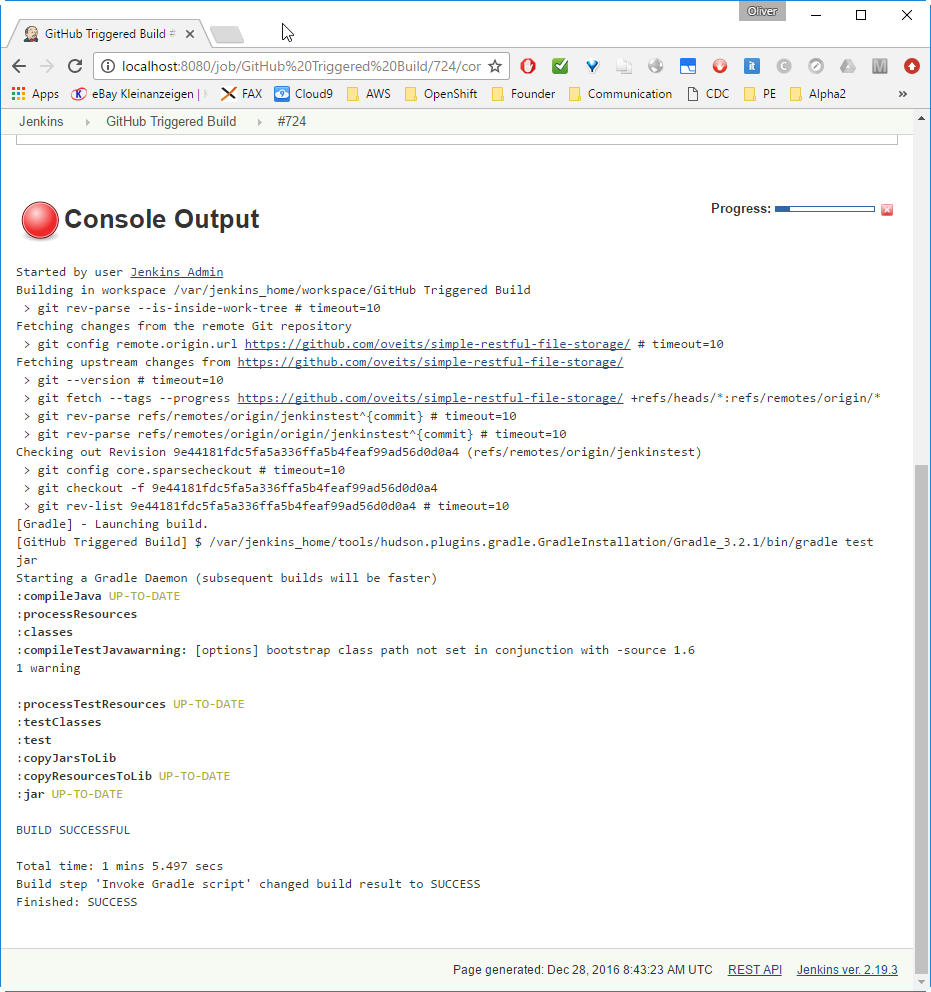
Don’t be confused by the blinking red ball on the upper left of the Console Output page: we see a BUILD SUCCESSFUL message and if we re-enter the same page, the ball is turned to static blue, indicating a successful build.
Step 4: Add JUnit Test Result Reporting to Jenkins
Now we will show how to add the JUnit test reports to the Jenkins build process.
Step 4.1: Install Jenkins JUnit Plugin
For Jenkins JUnit reporting, we need to install the JUnit Plug-in. For that, goto -> Jenkins Dashboard -> Manage Jenkins -> Manage Plugins -> Available -> Enter „JUnit Plugin“ to the Find field -> Install
Note: If you do not find the plugin on the Available tab, search for it in the „Installed“ tab.
You can install the plugin without reloading Jenkins.
Step 4.2: Configure Jenkins to collect and display the JUnit Test Results
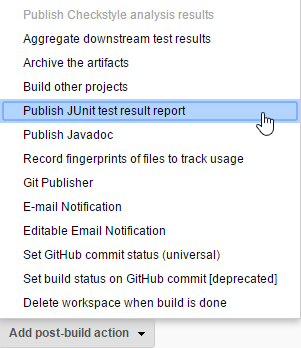
In this step, we will configure Jenkins, so it will display the test results for individual builds as well as trend reporting. For that, navigate to:
Jenkins -> (choose Project) -> Configure -> Post-build Actions -> Publish JUnit test results report
Add
**/build/test-results/test/TEST-*.xml
to the „Test report XMLs“ field, since this is the path, where Gradle is placing its JUnit test result reports (I have found the info here).
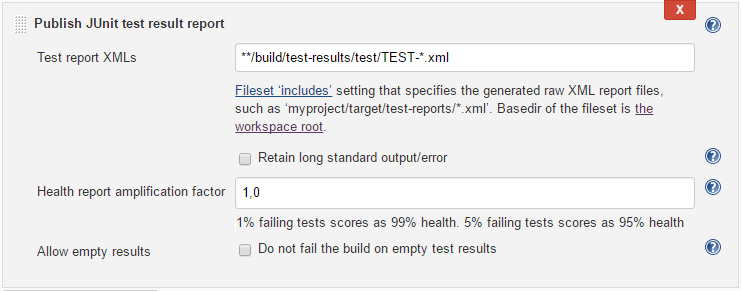
Now click ![]() .
.
Step 4.3: Verify JUnit individual Test Reporting
To test the Jenkins JUnit reporting feature, we trigger a clean build by adding „clean“ to the Gradle tasks on Project -> Configure -> Build:
and clicking ![]() .
.
Then trigger a new build by clicking on Project -> Build now.
Then click on the Build Process, and then on Console output:

…scrolling down…
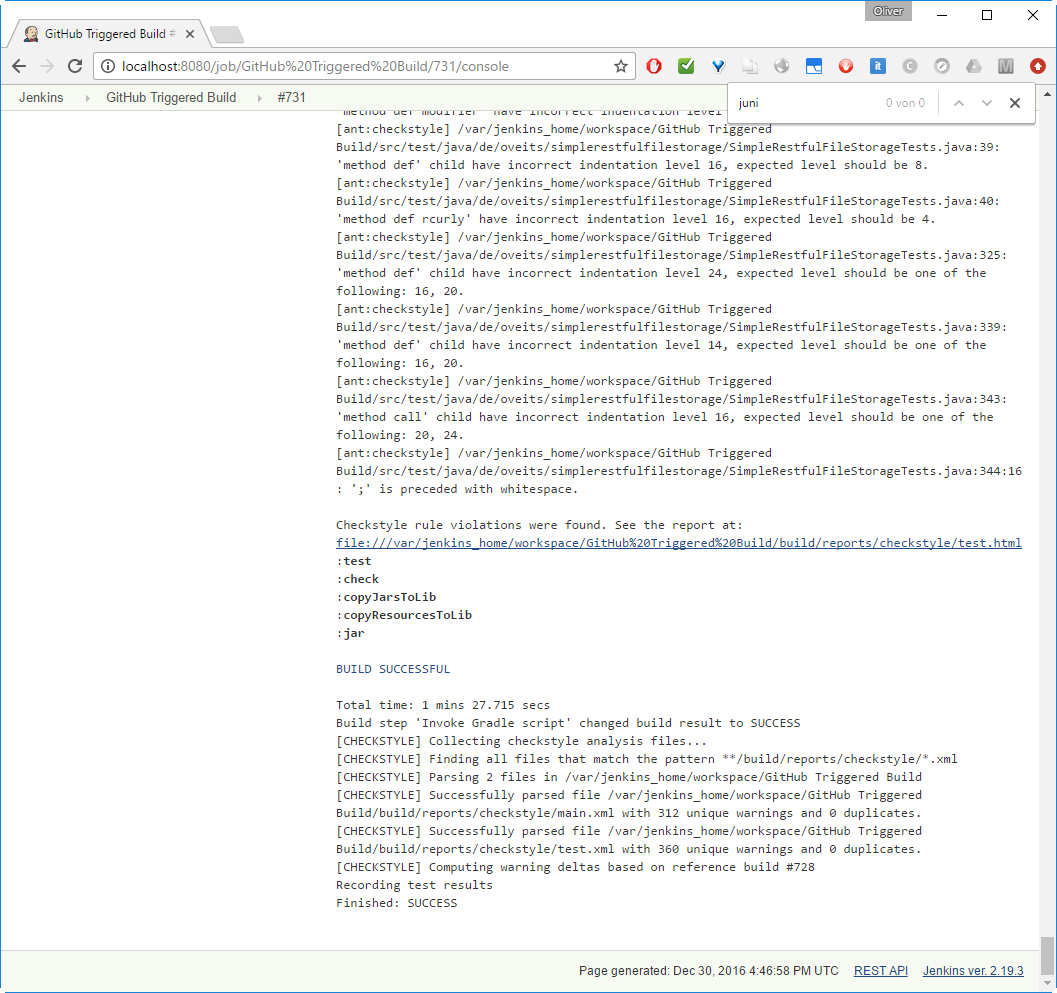
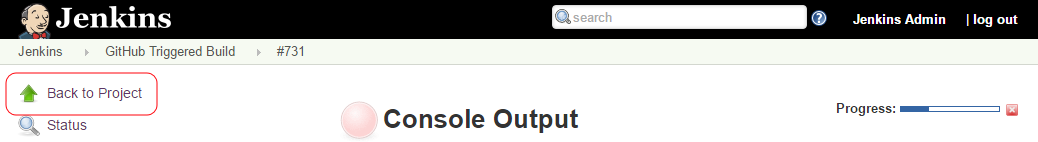
Do not be confused that the build process never seems to finish. Just click the Back to Project link:
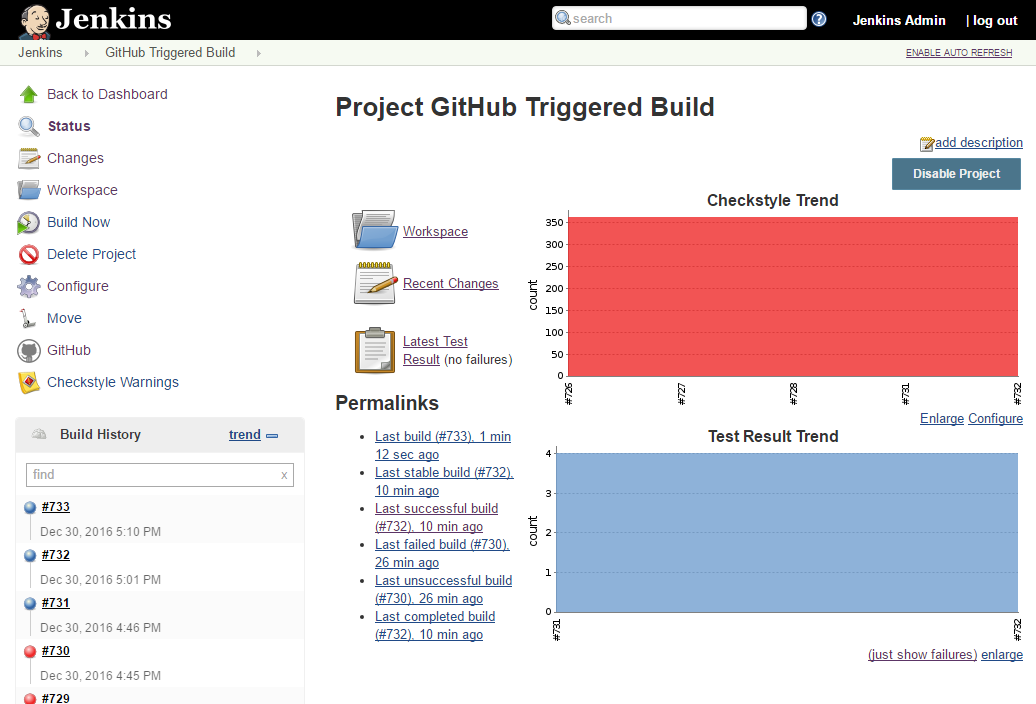
On the Status page, we see that there were no failed tests:
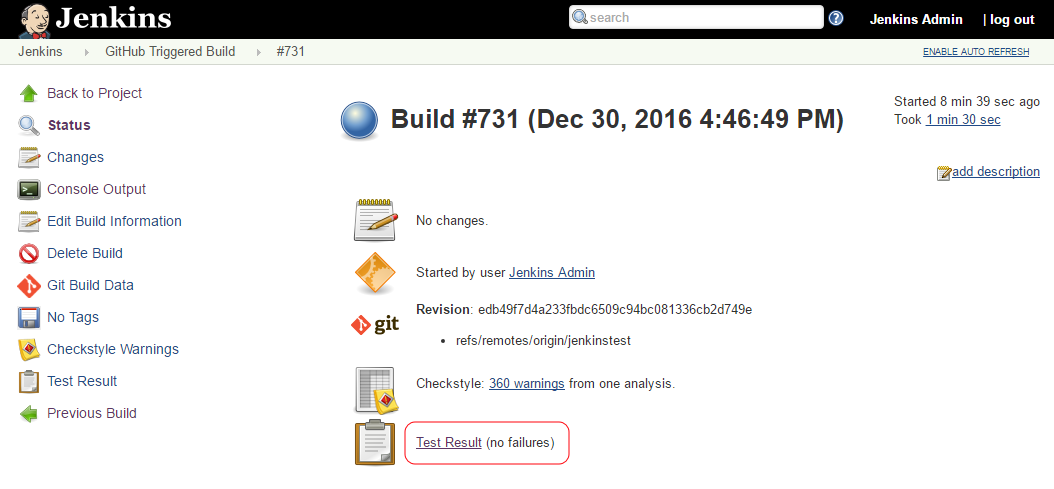
When we click on the Tests Result link on the left (or on the lower middle part on the Status page), we will see more details:

We can see that we have had four tests (Create/Read/Update/Delete a file) and 100% of them were successful.
Step 4.3: Verify JUnit Test Trend Reporting
On the project’s Status page, a Test Trend graph is automatically added, as soon as there are two or more tests available. For that, click on „Build Now“ on the left for a second time and click ENABLE AUTO REFRESH on the upper right. After the second build is complete, the (hopefully) blue Test Result Trend graph is showing up on the project status page:
The new blue graph shows that we had 4 successful tests in the last two builds.
Note: disregard the red Checkstyle Trend graph for now. This is something we will cover in the next blog post.
Step 5: Verify failed Test Reporting
Per default, Gradle build will fail, if one of the JUnit tests has failed, so it is building a strict quality gate. Will the test result be collected and reported nevertheless?
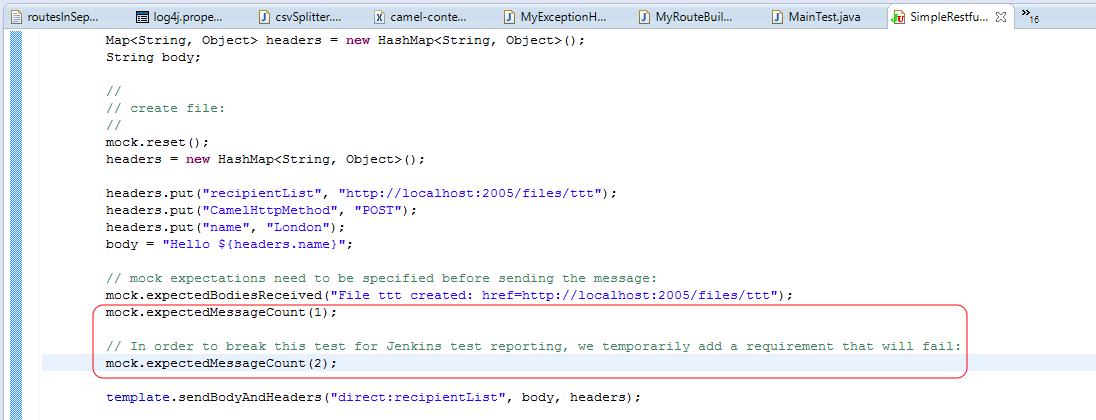
Let us test this now by breaking one of the JUnit tests by purpose. We have added an assert message that is expected to fail in one of the tests:
Now we commit and push the change to the SW repository:
$ git clone <Repository-URL>
$ cd <Repository Dir>
<perform the code changes here...>
$ git diff src/test/java/de/oveits/simplerestfulfilestorage/SimpleRestfulFileStorageTests.java
diff --git a/src/test/java/de/oveits/simplerestfulfilestorage/SimpleRestfulFileStorageTests.java b/src/test/java/de/oveits/simplerestfulfilestorage/SimpleRestfulFileStorageTests.java
index 684d30f..10200d5 100644
--- a/src/test/java/de/oveits/simplerestfulfilestorage/SimpleRestfulFileStorageTests.java
+++ b/src/test/java/de/oveits/simplerestfulfilestorage/SimpleRestfulFileStorageTests.java
@@ -115,6 +115,9 @@ public class SimpleRestfulFileStorageTests extends CamelSpringTestSupport {
 // mock expectations need to be specified before sending the message:
 mock.expectedBodiesReceived("File ttt created: href=http://localhost:2005/files/ttt");
 mock.expectedMessageCount(1);
+ ^M
+ // In order to break this test for Jenkins test reporting, we temporarily add a requirement that will fail:^M
+ mock.expectedMessageCount(2);^M

 template.sendBodyAndHeaders("direct:recipientList", body, headers);

$ git add src/test/java/de/oveits/simplerestfulfilestorage/SimpleRestfulFileStorageTests.java
$ git commit -m "Breaking a JUnit test by purpose for Jenkins reporting tests"
[jenkinstest 33655b9] Breaking a JUnit test by purpose for Jenkins reporting tests
 1 file changed, 4 insertions(+), 1 deletion(-)

olive@LAPTOP-P5GHOHB7 /d/veits/eclipseWorkspaceRecent/simple-restful-file-storage (jenkinstest)
$ git push
Counting objects: 9, done.
Delta compression using up to 8 threads.
Compressing objects: 100% (6/6), done.
Writing objects: 100% (9/9), 744 bytes | 0 bytes/s, done.
Total 9 (delta 4), reused 0 (delta 0)
remote: Resolving deltas: 100% (4/4), completed with 4 local objects.
To https://github.com/oveits/simple-restful-file-storage.git
 edb49f7..33655b9 jenkinstest -> jenkinstest
This will automatically trigger a new build (if you have followed part 3 of this series; otherwise just press „Build Now“ on Jenkin’s project page).
We can see on the dashboard, that the build has failed:
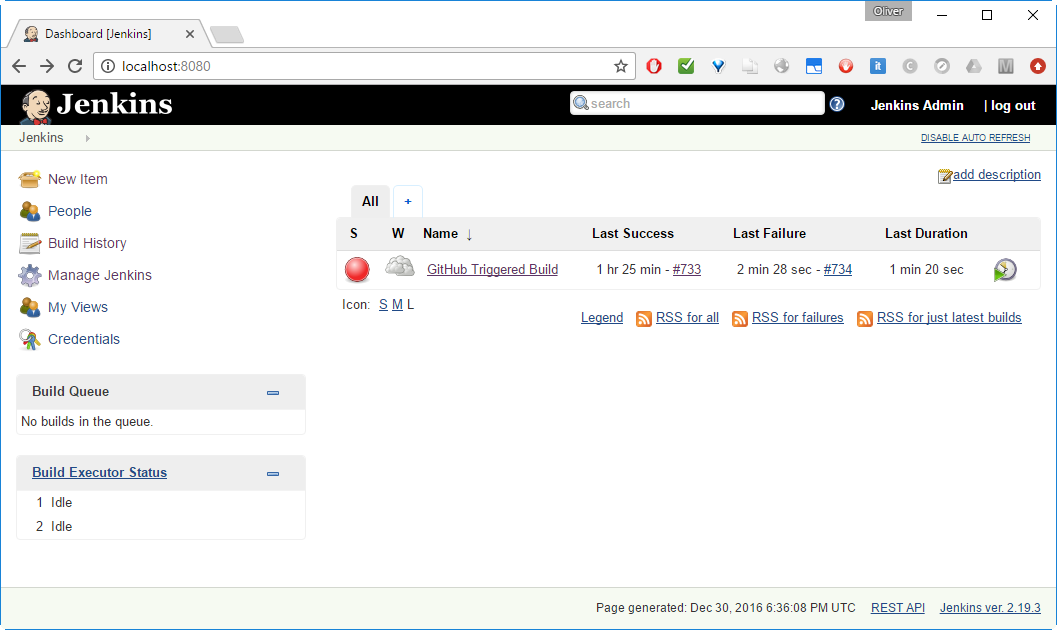
This was expected. Now let us click on the Project name, and we will see, what happened:
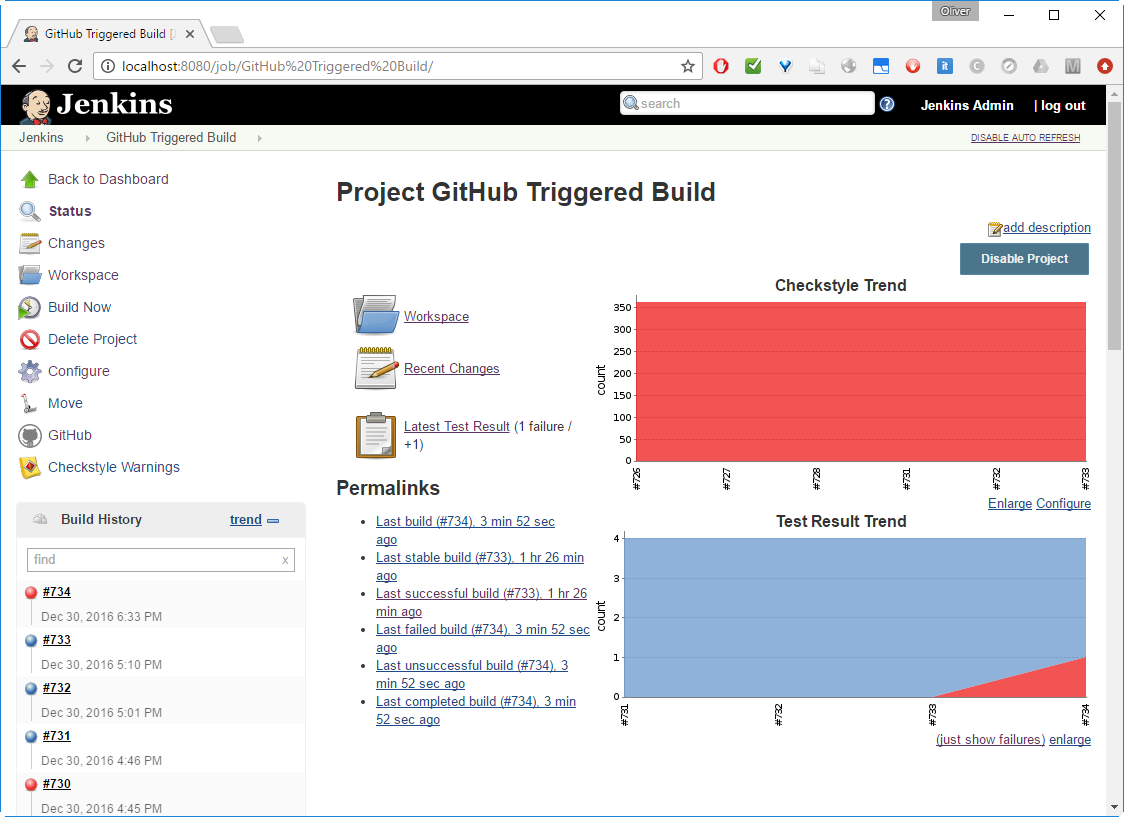
Perfect, that is exactly, what I wanted to achieve: On the Test Result Trend, we can see that we have performed 4 tests, one of which has failed.
Let us fix the failed test by commenting out (or removing) the wrong code again:

After
$ git add <file>
$ git commit -m "Fixed JUnit test again to test Jenkins JUnit trend report"
$ git push
The next build should be successful again and we can see in the trends graph that the failed test is fixed again:

Summary
In this blog post, we have shown
- How to add Java functional tests to the Jenkins build pipeline based on Gradle JUnit Plugin
- How to install the JUnit plug-in to Jenkins for report collection
- How to display JUnit test results for individual builds on the Jenkins portal
- How to display JUnit trend analysis on the Jenkins portal
The only challenge I have encountered is, that I had to re-write my JUnit tests in a way that they were successful when run stand-alone. Before they were successful only, if the executable JAR file was started manually before running the JUnit tests. This was resolved in a way specific to the framework used (Apache Camel in this case).
Coming Soon: Code Analysis Trend Analysis via Jenkins Checkstyle plugin
Further Reading
- Jenkins Homepage
- Jenkins JUnit Plugin
- Nice blog post on NelsonWells.net about Jenkins JUnit test reporting I have borrowed the first trend analysis graph in the introduction from (since it looks better than mine 😉 )
- Part 1 of this Series: Installation and Configuration of Jenkins, loading plugins
- Part 2 of this Series: Creating our first Jenkins job: GitHub download and Software build
- Part 3 of this Series: Periodic vs Triggered Builds