In this article, we will compare three ways of installing Metricbeat on Kubernetes. Metricbeat helps us monitoring performance indicators like CPU, Memory, Disk and many more on your Kubernetes nodes.
Tl;dr
Option 3, i.e. installing Metricbeat via helm based on values file is the quickest way of installing Metricbeat. You need to copy the Metricbeat chart’s values file, adapt it to your needs and run the following command:
helm upgrade --install --force metricbeat stable/metricbeat --namespace metricbeat --values ./values.yaml
Introduction
In our previous article, we have installed Kibana using Helm charts for visualization of ElasticSearch data. This time, we will make sure that data is fed into the ElasticSearch database, so we can visualize the resource consumption of our Kubernetes nodes.
We will test and compare three independent installation options:
- manual installation on the CentOS Kubernetes nodes
- Helm-style installation with „set“ options
- Helm-style installation with a „values“ YAML file.
Any of those options will lead to nice Kibana dashboards as the following:

Versions tested
- CentOS 7
- Docker 18.06.1-ce (installation instructions)
- kubectl v1.13.2 (installation instructions for a kubeadm cluster)
- Elasticsearch v6.5.4 (installation instructions)
- Kibana v6.5.4 (installation instructions)
- Metricbeat native: v6.5.4 (see Option 1 in this blog post)
- Metricbeat via Helm: v6.6.1 (see Option 2 and 3 in this blog post)
Option 1: Manually install Metricbeat (CentOS)
Here, we will learn how to install Metricbeat manually on CentOS systems. In option 2 and 3 below, we will learn how to use Helm charts to install Metricbeat. The easiest way is option 3.
RPM Step 1.1:
On Linux systems supporting RPM, we can install Metricbeat as follows:
curl -L -O https://artifacts.elastic.co/downloads/beats/metricbeat/metricbeat-6.5.4-x86_64.rpm
sudo rpm -vi metricbeat-6.5.4-x86_64.rpm
The output should look similar to follows:
$ curl -L -O https://artifacts.elastic.co/downloads/beats/metricbeat/metricbeat-6.5.4-x86_64.rpm
  % Total    % Received % Xferd  Average Speed   Time    Time     Time  Current
                                 Dload  Upload   Total   Spent    Left  Speed
100 18.9M  100 18.9M    0     0  10.5M      0  0:00:01  0:00:01 --:--:-- 10.5M
$ sudo rpm -vi metricbeat-6.5.4-x86_64.rpm
warning: metricbeat-6.5.4-x86_64.rpm: Header V4 RSA/SHA512 Signature, key ID d88e42b4: NOKEY
Preparing packages...
metricbeat-6.5.4-1.x86_64
Step 1.2: Configure Metricbeat
Open the file metricbeat-6.5.4-darwin-x86_64/metricbeat and adapt the configuration, if needed. As a first test, we will run Metricbeat on the Kubernetes node hosting the ElasticSearch server. The latter can be reached on the client’s POD. Therefore, we can detect the ElasticSearch URL the same way, as we did in our Kibana article:
[ "$RELEASE" == "" ] \
  && RELEASE=metricbeat-v1
[ "$ELASTICSEARCH_URL" == "" ] \
  && ELASTICSEARCH_URL=http://$(kubectl get svc -n elasticsearch | grep 'elastic.*client' | head -n 1 | awk '{print $1}'):9200

[ "$KIBANA_URL" == "" ] \
  && KIBANA_URL=http://$(kubectl get svc -n elasticsearch | grep 'kibana' | head -n 1 | awk '{print $1}'):5601
After that, the environment variables should have values similar to follows:
echo $RELEASE

# output:
metricbeat-v1
$ echo $ELASTICSEARCH_URL

# output:
http://elasticsearch-v1-client:9200
echo $KIBANA_URL

# output:
http://kibana-v1:5601
We now modify the file /etc/metricbeat/metricbeat.yml accordingly (with sudo):
  # Array of hosts to connect to.
  #hosts: ["elasticsearch-v1-client:9200"]
  # since CLUSTER-IP or Elastic is 0.106.165.136, in my case:
  hosts: ["10.106.165.136:9200"]
and Kibana needs to be configured, so Metricbeat can set it up:
setup.kibana:
  #host: "kibana-v1:5601"
  #host: "localhost:30000"
  # or, if CLUSTER-IP of Kibana is 10.99.174.220:
  host: "10.99.174.220:5601"
According to the comments in the file, the scheme and port can be left out and will be set to the defaults (http and 5601). For IPv6, we always need to specify the full information, e.g. https://[2001:db8::1]:5601.
Step 1.3: Disable the Kubernetes Module
At this point, do not yet enable the Kubernetes Module yet. The Metricbeat Kubernetes Module is handled in the Appendix (work in progress). In a fresh installation, only the system module is enabled, so you do not need to do anything. However, just to be sure, we can disable the module as follows:
sudo metricbeat modules disable kubernetes
Step 1.4: Create Kibana Dashboards
Once Kibana is reachable via the host+port configured on metricbeat.yml, setting up the Metricbeat dashboard is as simple as issuing a single command:
sudo metricbeat setup

# output:
Loaded index template
Loading dashboards (Kibana must be running and reachable)
Loaded dashboards
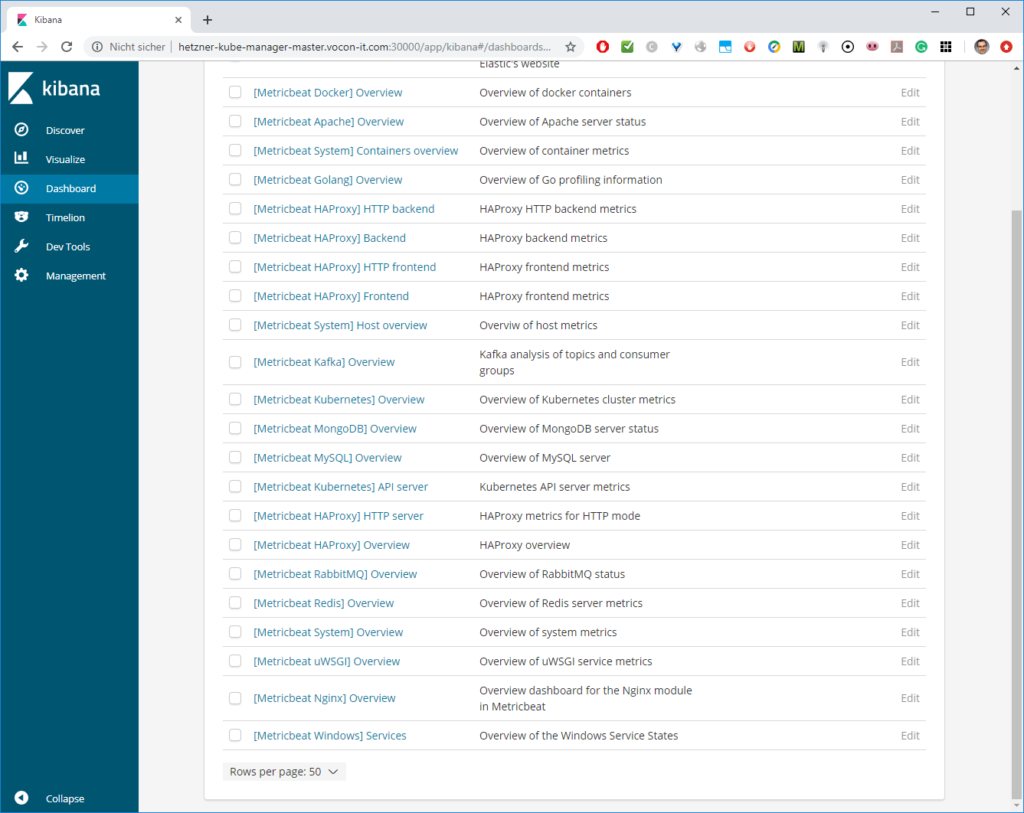
This will create around 20 dashboards:
As long as metricbeat has not been started, the dashboards will be empty:

Step 1.5: Start Metricbeat Agent
On the Kubernetes Node, let us start the Metricbeat service:
sudo service metricbeat start

# output:
Starting metricbeat (via systemctl):                       [  OK  ]
This will start the service. However, since the service is not yet enabled, the service will not survive a reboot of the machine. Let us change this:
sudo systemctl enable metricbeat

# output:
Created symlink from /etc/systemd/system/multi-user.target.wants/metricbeat.service to /usr/lib/systemd/system/metricbeat.service.
Step 1.6: View System Dashboards
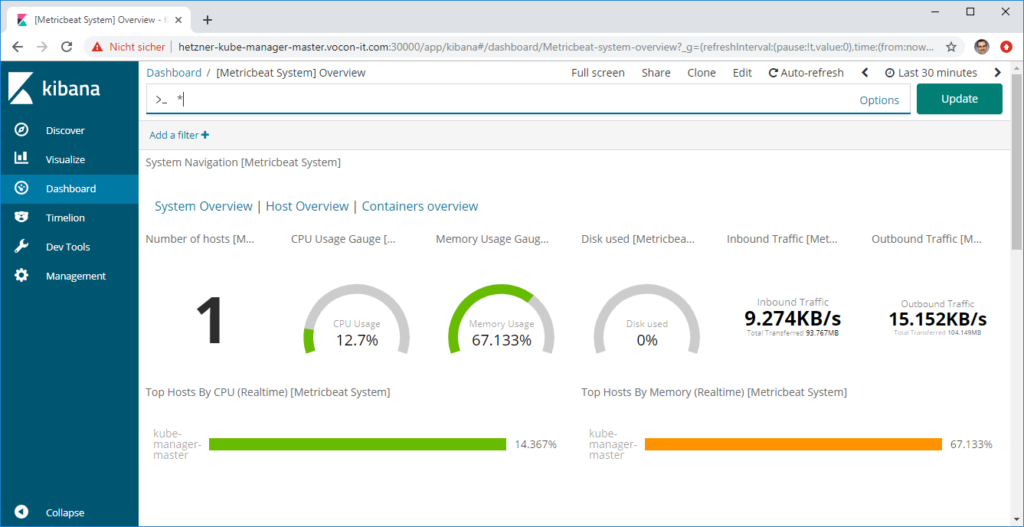
Now we can view the System dashboards: on the Dashboards menu item, we search for „System“ and choose the Overview option:

This will reveal something like follows:
We can choose one of the hosts by choosing the „Host Overview“. In our case, there is only one host available, i.e. the host which is hosting the ElasticSearch and Kibana servers. Still, it is interesting, how much resources the ElasticSearch stack is consuming:
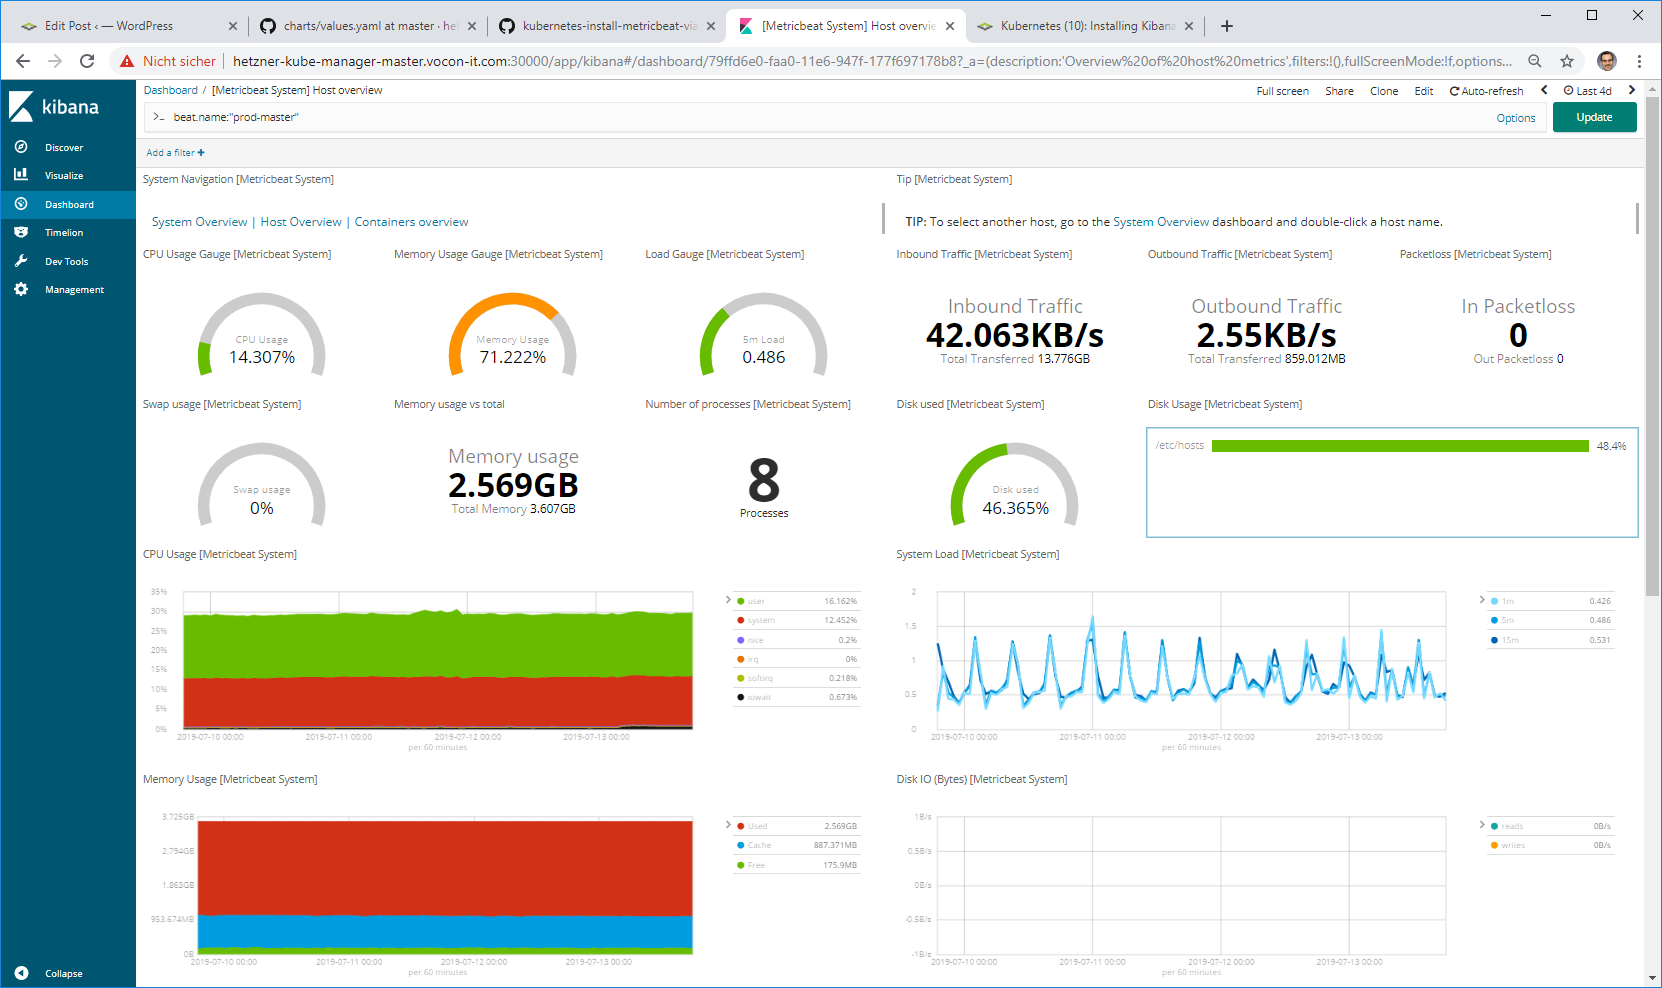
We can see that 5 of 8 GB RAM is used and that the average CPU consumption is around 30%. Moreover, 19% of the main disk is used, whereas the additional disk, where the ElasticSearch database is located, is almost empty.
In the lower part, we can see that most of the Network traffic is from and to the loopback interface. There is almost no external network traffic:

Option 2: Install Metricbeat via Helm with –set Options
Step 2.0: Install Helm
For that, follow the steps 1.1 and 1.2 of this blog post.
Step 2.1: Install Metricbeat
Above, we have installed Metricbeat classically on a Linux system. In the current phase, we investigate how Helm Charts can help us installing Metricbeat on a Kubernetes Cluster. In addition, we will learn how to connect the Kubernetes Nodes to an external ElasticSearch database.
By looking to the metricbeat stable helm chart values.yaml file, I have created an OPTIONS variable that defines all deviations I want to introduce.
RELEASE=metricbeat-v1
NAMESPACE=metricbeat
PERIOD=1m
OPTIONS=" --set daemonset.config.output\.file.enabled=false \
      --set daemonset.config.output\.elasticsearch.enabled=true \
      --set daemonset.config.output\.elasticsearch.hosts[0]=elasticsearch.vocon-it.com:80 \
      --set daemonset.modules.kubernetes.config[0].module=kubernetes \
      --set daemonset.modules.kubernetes.config[0].host=\$\{NODE_NAME\} \
      --set daemonset.modules.kubernetes.config[0].period=${PERIOD} \
      --set daemonset.modules.kubernetes.config[0].hosts[0]=127.0.0.1:10255 \
      --set daemonset.modules.kubernetes.config[0].metricsets[0]=node \
      --set daemonset.modules.kubernetes.config[0].metricsets[1]=system \
      --set daemonset.modules.kubernetes.config[0].metricsets[2]=pod \
      --set daemonset.modules.kubernetes.config[0].metricsets[3]=container \
      --set daemonset.modules.kubernetes.config[0].metricsets[4]=volume \
      --set daemonset.modules.system.config[0].metricsets[0]=cpu \
      --set daemonset.modules.system.config[0].metricsets[1]=load \
      --set daemonset.modules.system.config[0].metricsets[2]=memory \
      --set daemonset.modules.system.config[0].metricsets[3]=network \
      --set daemonset.modules.system.config[0].metricsets[4]=process \
      --set daemonset.modules.system.config[0].metricsets[5]=process_summary \
      --set daemonset.modules.system.config[0].module=system \
      --set daemonset.modules.system.config[0].period=${PERIOD} \
      --set daemonset.modules.system.config[0].process\.include_top_n.by_cpu=5 \
      --set daemonset.modules.system.config[0].process\.include_top_n.by_memory=5 \
      --set daemonset.modules.system.config[0].processes[0]=\.\* \
      --set daemonset.modules.system.config[1].metricsets[1]=filesystem \
      --set daemonset.modules.system.config[1].metricsets[0]=fsstat \
      --set daemonset.modules.system.config[1].module=system \
      --set daemonset.modules.system.config[1].period=${PERIOD} \
      --set deployment.config.output\.file.enabled=false \
      --set deployment.config.output\.elasticsearch.enabled=true \
      --set deployment.config.output\.elasticsearch.hosts[0]=elasticsearch.vocon-it.com:80 \
      --set deployment.modules.kubernetes.enabled=true \
      --set deployment.modules.kubernetes.config[0].module=kubernetes \
      --set deployment.modules.kubernetes.config[0].metricsets[0]=state_node \
      --set deployment.modules.kubernetes.config[0].metricsets[1]=state_deployment \
      --set deployment.modules.kubernetes.config[0].metricsets[2]=state_replicaset \
      --set deployment.modules.kubernetes.config[0].metricsets[3]=state_pod \
      --set deployment.modules.kubernetes.config[0].metricsets[4]=state_container \
      --set deployment.modules.kubernetes.config[0].period=${PERIOD} \
      --set deployment.modules.kubernetes.config[0].hosts=[\"kube-state-metrics:8080\"] \
      --set extraEnv[0].name=ELASTICSEARCH_HOST \
      --set extraEnv[0].value=elasticsearch.vocon-it.com \
      --set extraEnv[1].name=ELASTICSEARCH_PORT \
      --set extraEnv[1].value="\""80"\"" \
      --namespace ${NAMESPACE}"

helm upgrade --install ${RELEASE} --force stable/metricbeat $OPTIONS
The blue and red part is needed in order to specify an IPv4 address. If it is omitted, Metricbeat tries to connect to the IPv6 loopback address [::1].
Note that it is not possible to just specify the IP-address in the line with the red 127.0.0.1. Instead, the whole blue section is needed for not reseting the config.
Caveat: the pain with the Kubernetes Module
Later, I have found a caveat in my installations: my Kubernetes installation is not listening on port 10250, but it is listening on port 10255 with the HTTPS protocol. However, the HTTPS endpoint seems to require a certification verification as well as a client authorization. Since most of the metrics I am interested in now are working also without correct connection to 127.0.0.1:10255, I am living with this caveat for now.
If you are encountering the same problem, my tip, for now, is to disable the Kubernetes part altogether: just replace the blue part by following two lines:
...
 --set daemonset.modules.kubernetes.config[0].module=kubernetes \
 --set daemonset.modules.kubernetes.config[0].enagled=false
...
Still, quite interesting data will be displayed in the dashboards.
Step 2.2: View System Dashboards
We will access the Kibana service we had installed in this previous blog post. Here we have chosen the system view of the system, we just have provided with the Metricbeat installation: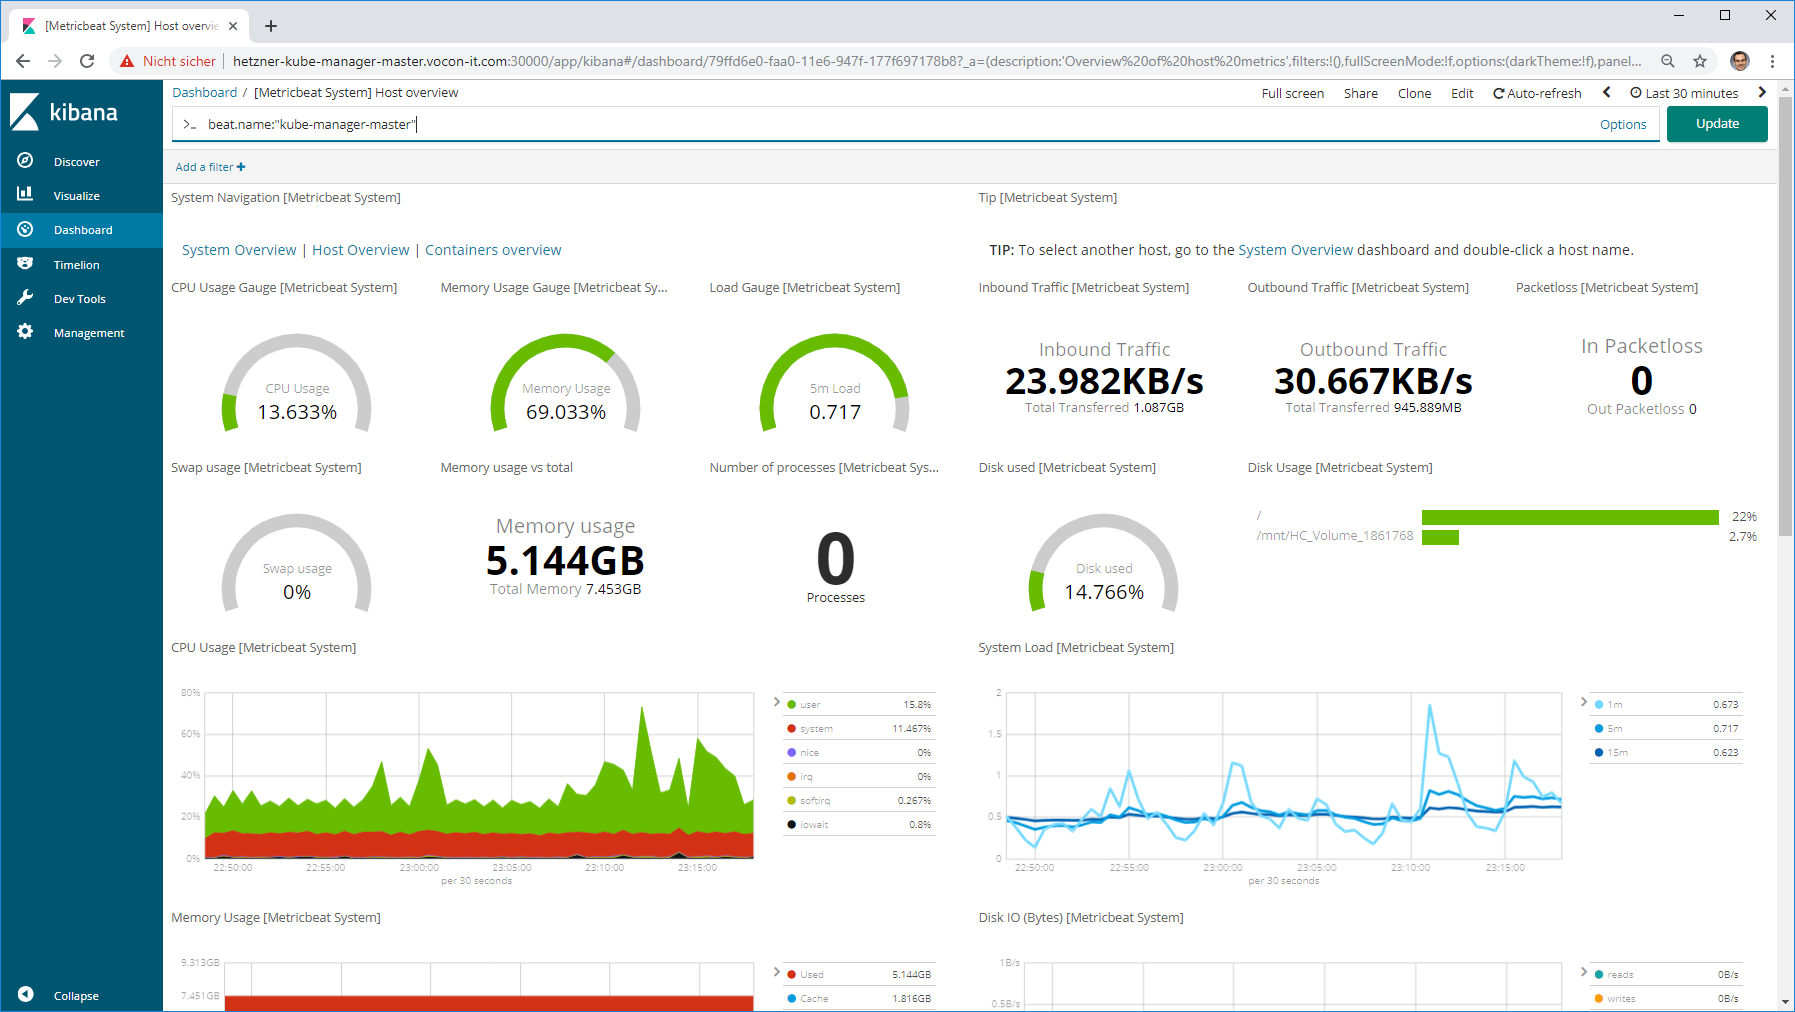


Option 3: Install Metricbeat via Helm with values File(s)
Step 3.0: Install Helm
For that, follow the steps 1.1 and 1.2 of this blog post.
Step 3.1: Install Metricbeat
Above, we have installed Metricbeat with many –set options. However, we have found it quite cumbersome to create the –set options from the chart’s values files. Therefore, we would like to test another way of installing Metricbeat: instead of converting parts of the chart’s values.yaml file to –set options, we just copy and adapt the chart’s values.yaml file.
The chart’s values.yaml file can be found here on GitHub. We just copy and adapt the values.yaml file to our needs. Moreover, we replace some values by variables, so we can adapt them more easily later on. We add a suffix .tmpl, so it is clear that it is a template. All the changes I have performed are marked in blue:
image:
  repository: docker.elastic.co/beats/metricbeat
  tag: 6.6.1
  pullPolicy: IfNotPresent

# The instances created by daemonset retrieve most metrics from the host
daemonset:
  podAnnotations: []
  tolerations:
  - key: node-role.kubernetes.io/master
    operator: Exists
    effect: NoSchedule
  nodeSelector: {}
  resources: {}
  config:
    output.file:
      enabled: false
    output.elasticsearch:
      enabled: true
      hosts:
        - ${ELASTIC_SEARCH_HOST}:${ELASTIC_SEARCH_PORT}
    metricbeat.config:
      modules:
        path: ${path.config}/modules.d/*.yml
        reload.enabled: false
    processors:
    - add_cloud_metadata:
  modules:
    system:
      enabled: true
      config:
        - module: system
          period: ${PERIOD}
          metricsets:
            - cpu
            - load
            - memory
            - network
            # - core
            # - diskio
            # - socket
        - module: system
          period: ${PERIOD_LONG}
          metricsets:
            - fsstat
            - filesystem
            - process
            - process_summary
          processes: ['.*']
          process.include_top_n:
            by_cpu: 5      # include top 5 processes by CPU
            by_memory: 5   # include top 5 processes by memory
    kubernetes:
      enabled: false
      config:
        - module: kubernetes
          metricsets:
            - node
            - system
            - pod
            - container
            - volume
          period: ${PERIOD}
          host: ${NODE_NAME}
          #hosts: ["127.0.0.1:10255"]
          # If using Red Hat OpenShift remove the previous hosts entry and
          # uncomment these settings:
          #hosts: ["https://${HOSTNAME}:10250"]
          # OV added; see https://discuss.elastic.co/t/metricbeat-kubernetes-module/91850/3
          #ssl.certificate_authorities: ["ca.pem"]
          #ssl.certificate: "abc.pem"
          #ssl.key: "abc-key.pem"
          # bearer_token_file: /var/run/secrets/kubernetes.io/serviceaccount/token
          # ssl.certificate_authorities:
            # - /var/run/secrets/kubernetes.io/serviceaccount/service-ca.crt
# The instance created by deployment retrieves metrics that are unique for the whole cluster, like Kubernetes events or kube-state-metrics
deployment:
  podAnnotations: []
  tolerations: []
  nodeSelector: {}
  resources: {}
  config:
    output.file:
      enabled: false
    output.elasticsearch:
      enabled: true
      hosts:
        - ${ELASTIC_SEARCH_HOST}:${ELASTIC_SEARCH_PORT}
  modules:
    kubernetes:
      enabled: true
      config:
        - module: kubernetes
          metricsets:
            - state_node
            - state_deployment
            - state_replicaset
            - state_pod
            - state_container
            # Uncomment this to get k8s events:
            # - event
          period: ${PERIOD}
          hosts: '["kube-state-metrics:8080"]'

# List of beat plugins
plugins: []
  # - kinesis.so

# additional environment
# extraEnv:
#  - name: test1
#    value: "test1"
#  - name: test2
#    value: "test2"
extraEnv:
  - name: ELASTICSEARCH_HOST
    value: "${ELASTIC_SEARCH_HOST}"
  - name: ELASTICSEARCH_PORT
    value: "${ELASTIC_SEARCH_PORT}"

# Add additional volumes and mounts, for example to read other log files on the host
extraVolumes: []
  # - hostPath:
  #     path: /var/log
  #   name: varlog
extraVolumeMounts: []
  # - name: varlog
  #   mountPath: /host/var/log
  #   readOnly: true

resources: {}
  # We usually recommend not to specify default resources and to leave this as a conscious
  # choice for the user. This also increases chances charts run on environments with little
  # resources, such as Minikube. If you do want to specify resources, uncomment the following
  # lines, adjust them as necessary, and remove the curly braces after 'resources:'.
  # limits:
  #  cpu: 100m
  #  memory: 200Mi
  # requests:
  #  cpu: 100m
  #  memory: 100Mi

rbac:
  # Specifies whether RBAC resources should be created
  create: true

serviceAccount:
  # Specifies whether a ServiceAccount should be created
  create: true
  # The name of the ServiceAccount to use.
  # If not set and create is true, a name is generated using the fullname template
  name:
The latest version of the file can be found on https://github.com/oveits/kubernetes-install-metricbeat-via-helm/blob/feature/0004-values.yaml-instead-of-set-commands/values.yaml.tmpl (it might move to the develop branch, later on, but I usually keep the feature branches as a reference.
Now we can apply the command as follows:
export RELEASE=metricbeat
export NAMESPACE=metricbeat
export PERIOD=1m
export PERIOD_LONG=10m
export ELASTIC_SEARCH_HOST=elasticsearch.vocon-it.com
export ELASTIC_SEARCH_PORT=80
export NODE_NAME='${NODE_NAME}'
envsubst < values.yaml.tmpl > values.yaml
helm upgrade --install --force ${RELEASE} stable/metricbeat --namespace ${NAMESPACE} --values ./values.yaml
Note: We have added the environment variable NODE_NAME to be ‚${NODE_NAME}‘, since we do not want envsubst to replace it by an empty string. We need to keep NODE_NAME as a variable evaluated by helm during the deployment.
Note also that I have chosen the helm upgrade command instead of the install command. This allows us to apply the command successfully, even if the helm release exists already. However, with the –install –force options, the upgrade command works also, if the helm release does not exist already.
If you not want to supersede any existing installtion, you also can use the install command, which will fail, if the release exist already:
helm install stable/metricbeat --name ${RELEASE} --namespace ${NAMESPACE} --values ./values.yaml
Step 3.2: View System Dashboards
Again, we will access the Kibana service we had installed in this previous blog post. The result is very similar to the one we have created in Option 2:
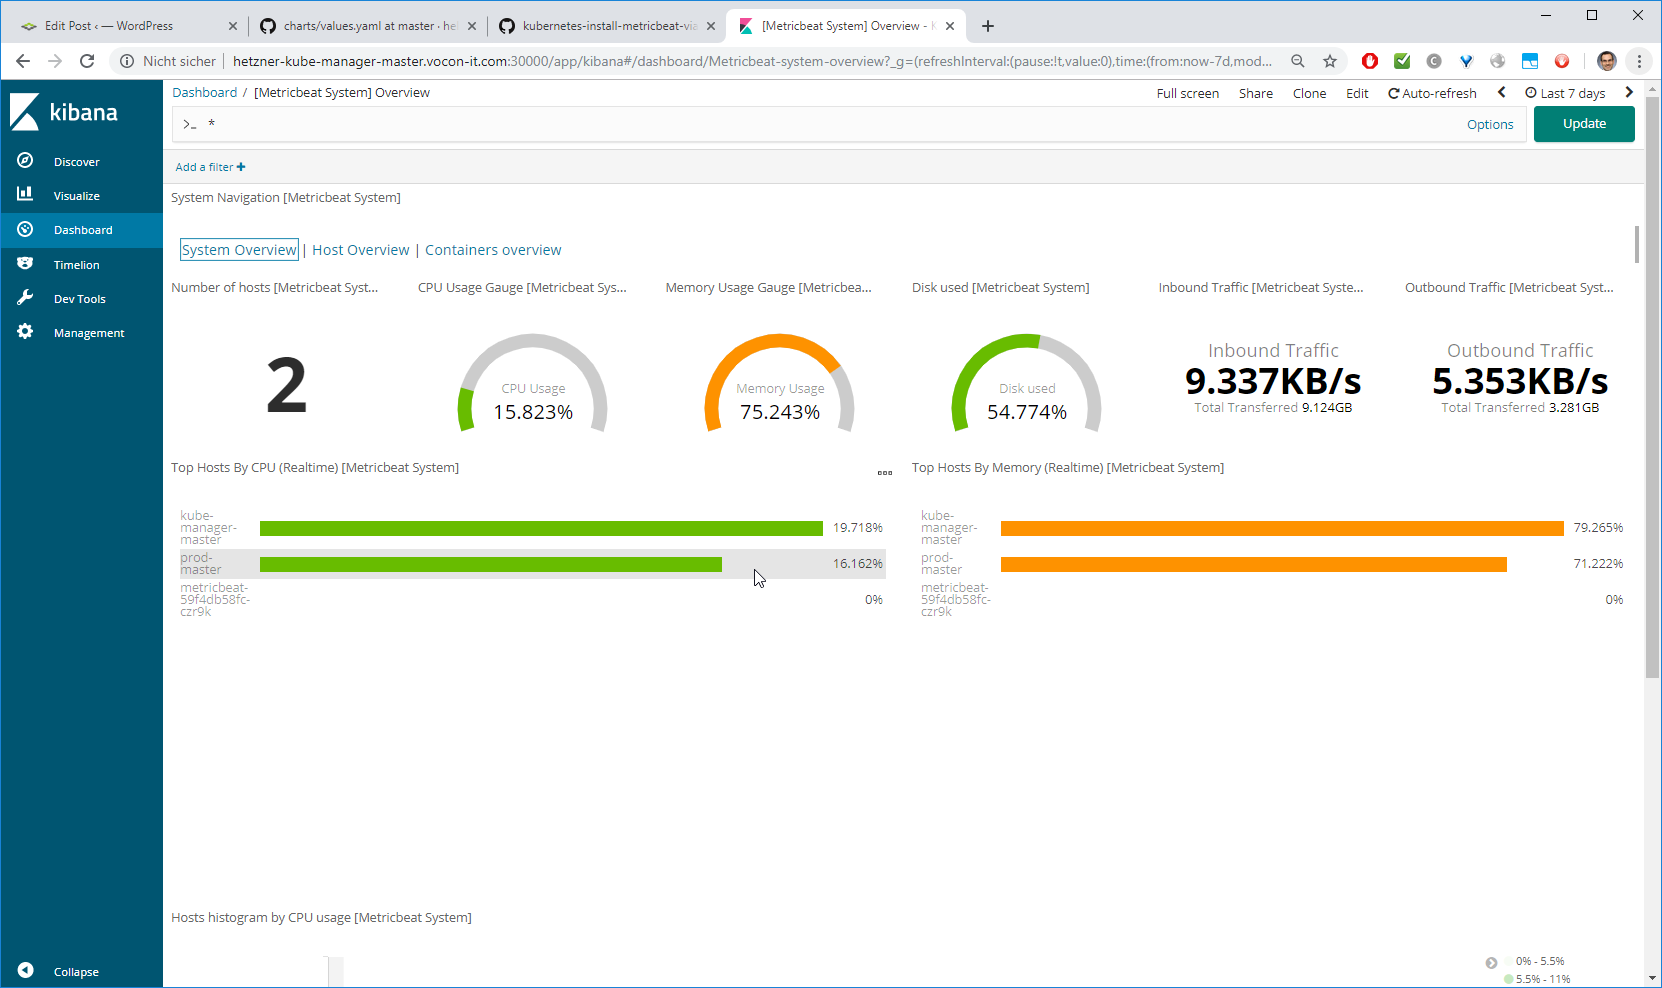
By clicking on the data representing our modified system, we reach the system overview (in my case: beat.name:“prod-master“):
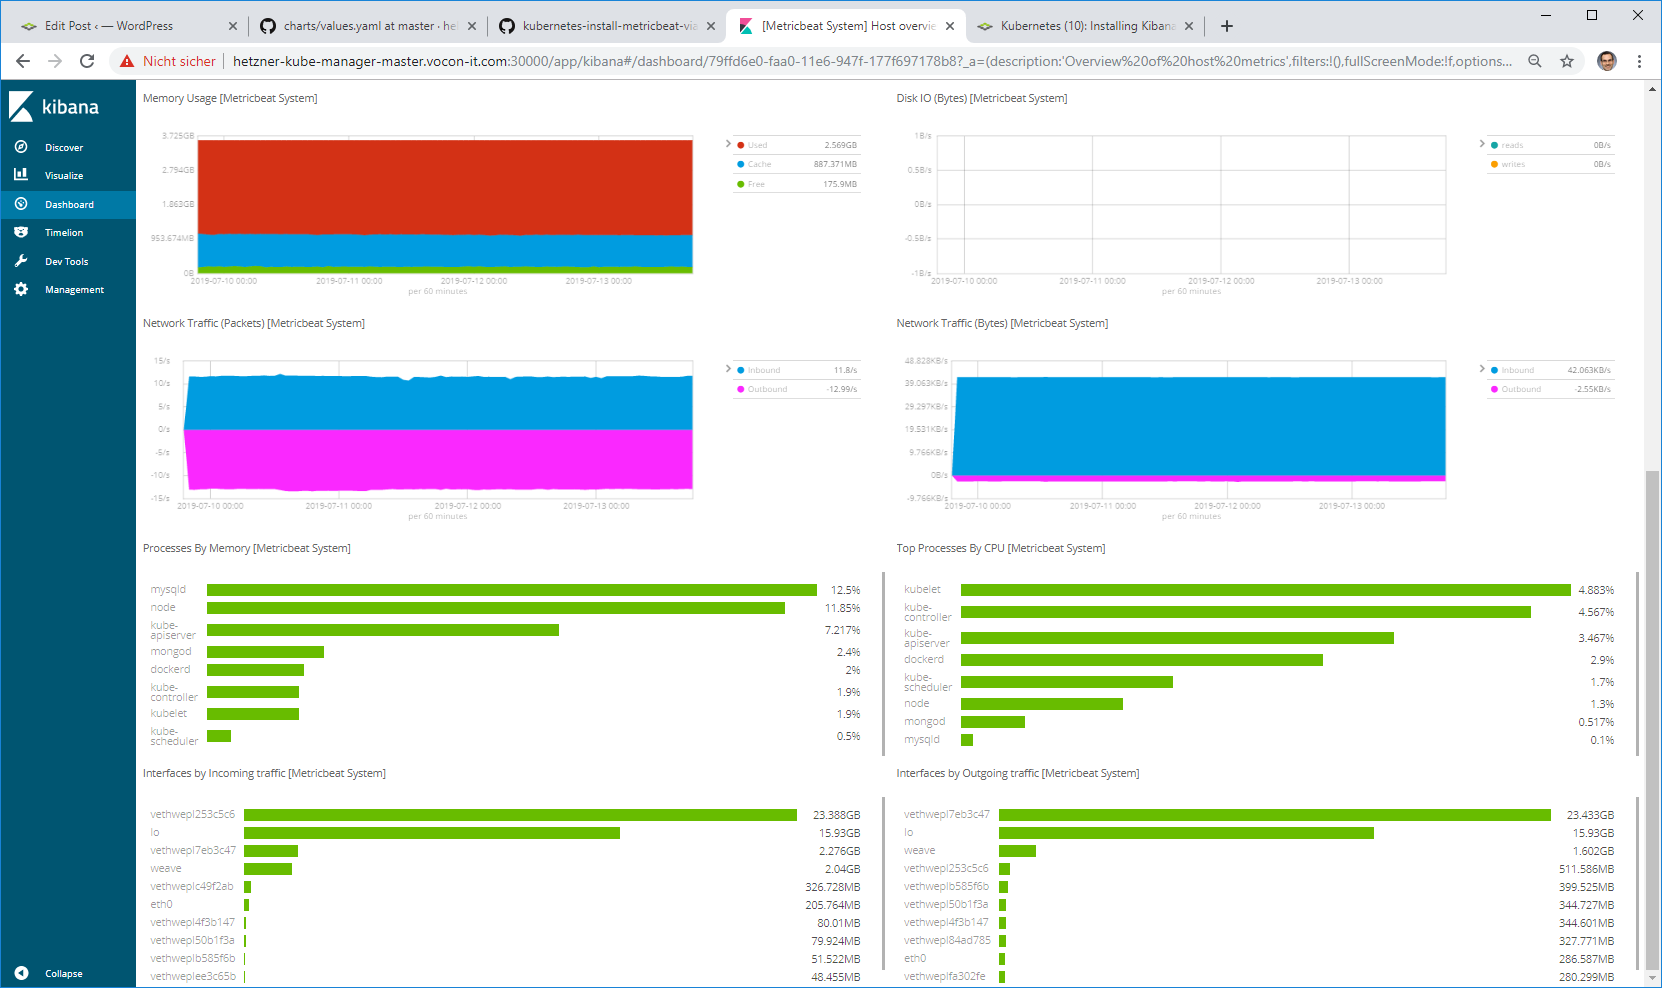
Scrolled down view:
Note that Kibana is a one-page application that does not show any load bars. You just might have to wait two minutes or so, until all visualizations are loaded.
Summary
We have compared the following three ways of installing Metricbeat on a Kubernetes cluster:
- native installation
- helm installation with set options
- helm installation with values file
In our case, we have performed the native installation on a CentOS system. Here, we have installed Metricbeat as a service. Compared to the other two ways of installation, the native installation was the most cumbersome. Other disadvantages are:
- the steps of the native installation vary from the operating system to operating system.
- we need to repeat the steps for each machine in the cluster. In this case,
Here a helm-based installation with ‚set‚ options promises a much lower effort. However, in most cases, we need to deviate from the defaults defined in the Metricbeat chart. For that, we need to convert the values in the values.yaml file to a format the –set option understands. This can be quite cumbersome and error-prone.
The best and quickest solution is to install Metricbeat with helm and the ‚values‚ option. In this case, we can deviate from the default values easily by copying and adapting the values.yaml. We even can convert the file to a template and use envsubst to replace variables by real values.
A good thing about the helm-way of installing a service is, that the software can be rolled out to all nodes in the cluster with a single command.