Super-short instructions how to place the breakpoint in an IDE in order to debug CORS issues in Spring Boot.
The problem with debugging CORS (like any other filter in spring boot security) is, that any request is blocked before they even enter any code of your own application. This can create quite some headaches how to debug the problem, if none of the breakpoints within the applications are ever passed.
One possible solution is to set the breakpoint within the spring-web jar as shown below.
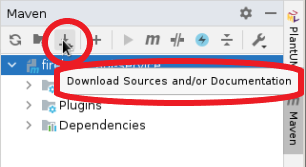
Step 0: Download Maven sources, if not already done
In the Maven Pane, look for the download icon and download the sources:
Step 1: Set the Breakpoint within spring-web
- In IntelliJ IDEA, on the left project pane, look for
Maven: org.springframework:spring-web:x.y.z. - Enter the file
web/cors/CorsConfiguration. - Look for the pattern/function
public String checkOrigin - Set a Breakpoint on the first line after the pattern
Step 2: Start a debugging Session and send the request to the application
- Start the the application in a debugging session
- Send the request to the application
Step 3: Compare requestOrigin with allowedOrigins
- Look at the variables
- requestOrigin
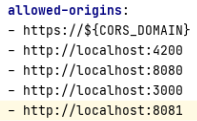
- allowedOrigins
In the example below, the requestOrigin „http://localhost:8081“ is not in the list allowedOrigins and will fail.

Add the requestOrigin to the list of security.allowedOrigins, if needed. In my case, I had to edit the application.yaml file. However, it might be a different story in your case.
DONE